Immigrants from South Africa vs Armenian Unemployment Among Ages 55 to 59 years
COMPARE
Immigrants from South Africa
Armenian
Unemployment Among Ages 55 to 59 years
Unemployment Among Ages 55 to 59 years Comparison
Immigrants from South Africa
Armenians
4.7%
UNEMPLOYMENT AMONG AGES 55 TO 59 YEARS
89.9/ 100
METRIC RATING
120th/ 347
METRIC RANK
5.3%
UNEMPLOYMENT AMONG AGES 55 TO 59 YEARS
0.0/ 100
METRIC RATING
285th/ 347
METRIC RANK
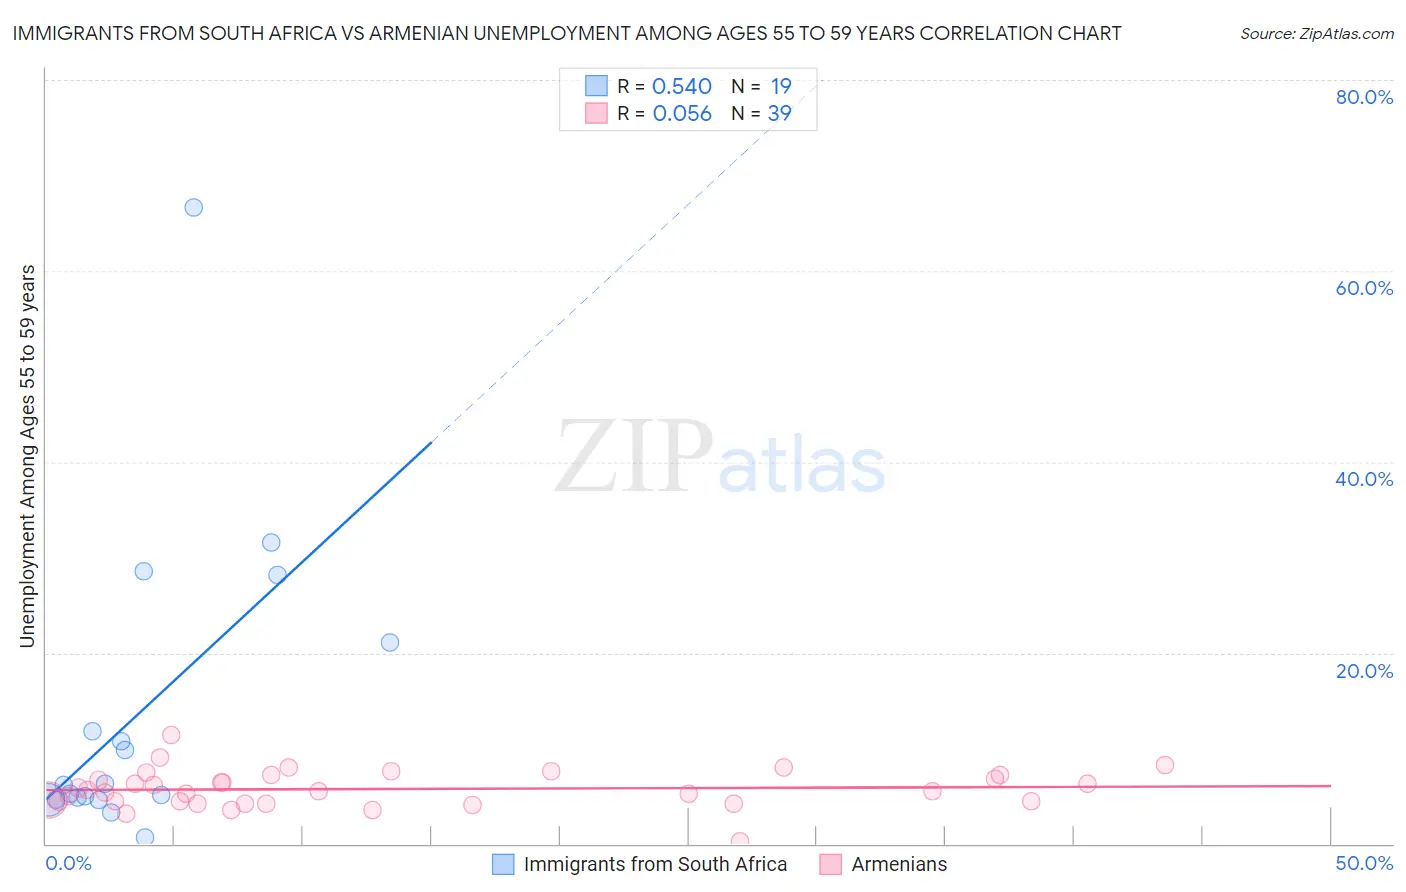
Immigrants from South Africa vs Armenian Unemployment Among Ages 55 to 59 years Correlation Chart
The statistical analysis conducted on geographies consisting of 222,856,764 people shows a substantial positive correlation between the proportion of Immigrants from South Africa and unemployment rate among population between the ages 55 and 59 in the United States with a correlation coefficient (R) of 0.540 and weighted average of 4.7%. Similarly, the statistical analysis conducted on geographies consisting of 295,177,302 people shows a slight positive correlation between the proportion of Armenians and unemployment rate among population between the ages 55 and 59 in the United States with a correlation coefficient (R) of 0.056 and weighted average of 5.3%, a difference of 12.2%.
Unemployment Among Ages 55 to 59 years Correlation Summary
| Measurement | Immigrants from South Africa | Armenian |
| Minimum | 0.70% | 0.20% |
| Maximum | 66.7% | 11.4% |
| Range | 66.0% | 11.2% |
| Mean | 13.6% | 5.7% |
| Median | 6.2% | 5.5% |
| Interquartile 25% (IQ1) | 4.6% | 4.4% |
| Interquartile 75% (IQ3) | 21.1% | 7.2% |
| Interquartile Range (IQR) | 16.5% | 2.8% |
| Standard Deviation (Sample) | 15.9% | 2.0% |
| Standard Deviation (Population) | 15.5% | 1.9% |
Similar Demographics by Unemployment Among Ages 55 to 59 years
Demographics Similar to Immigrants from South Africa by Unemployment Among Ages 55 to 59 years
In terms of unemployment among ages 55 to 59 years, the demographic groups most similar to Immigrants from South Africa are Pakistani (4.7%, a difference of 0.020%), Immigrants from Afghanistan (4.7%, a difference of 0.040%), Immigrants from Japan (4.7%, a difference of 0.050%), Immigrants from Chile (4.7%, a difference of 0.10%), and White/Caucasian (4.7%, a difference of 0.10%).
| Demographics | Rating | Rank | Unemployment Among Ages 55 to 59 years |
| Immigrants | Spain | 91.4 /100 | #113 | Exceptional 4.7% |
| Bangladeshis | 91.3 /100 | #114 | Exceptional 4.7% |
| South American Indians | 90.9 /100 | #115 | Exceptional 4.7% |
| Turks | 90.9 /100 | #116 | Exceptional 4.7% |
| Asians | 90.8 /100 | #117 | Exceptional 4.7% |
| Immigrants | Chile | 90.7 /100 | #118 | Exceptional 4.7% |
| Whites/Caucasians | 90.7 /100 | #119 | Exceptional 4.7% |
| Immigrants | South Africa | 89.9 /100 | #120 | Excellent 4.7% |
| Pakistanis | 89.7 /100 | #121 | Excellent 4.7% |
| Immigrants | Afghanistan | 89.5 /100 | #122 | Excellent 4.7% |
| Immigrants | Japan | 89.4 /100 | #123 | Excellent 4.7% |
| Lithuanians | 88.8 /100 | #124 | Excellent 4.7% |
| Immigrants | Malaysia | 87.9 /100 | #125 | Excellent 4.7% |
| Immigrants | Serbia | 87.8 /100 | #126 | Excellent 4.7% |
| Icelanders | 87.7 /100 | #127 | Excellent 4.7% |
Demographics Similar to Armenians by Unemployment Among Ages 55 to 59 years
In terms of unemployment among ages 55 to 59 years, the demographic groups most similar to Armenians are Ghanaian (5.3%, a difference of 0.10%), Immigrants from Ghana (5.3%, a difference of 0.12%), Apache (5.3%, a difference of 0.14%), Immigrants from Guatemala (5.3%, a difference of 0.14%), and Immigrants from Israel (5.3%, a difference of 0.15%).
| Demographics | Rating | Rank | Unemployment Among Ages 55 to 59 years |
| Immigrants | Barbados | 0.0 /100 | #278 | Tragic 5.2% |
| Alsatians | 0.0 /100 | #279 | Tragic 5.2% |
| Immigrants | Uzbekistan | 0.0 /100 | #280 | Tragic 5.3% |
| Guatemalans | 0.0 /100 | #281 | Tragic 5.3% |
| Immigrants | Trinidad and Tobago | 0.0 /100 | #282 | Tragic 5.3% |
| Apache | 0.0 /100 | #283 | Tragic 5.3% |
| Ghanaians | 0.0 /100 | #284 | Tragic 5.3% |
| Armenians | 0.0 /100 | #285 | Tragic 5.3% |
| Immigrants | Ghana | 0.0 /100 | #286 | Tragic 5.3% |
| Immigrants | Guatemala | 0.0 /100 | #287 | Tragic 5.3% |
| Immigrants | Israel | 0.0 /100 | #288 | Tragic 5.3% |
| Immigrants | Central America | 0.0 /100 | #289 | Tragic 5.3% |
| Sioux | 0.0 /100 | #290 | Tragic 5.3% |
| Trinidadians and Tobagonians | 0.0 /100 | #291 | Tragic 5.3% |
| British West Indians | 0.0 /100 | #292 | Tragic 5.3% |