Immigrants from Singapore vs Immigrants from Chile Unemployment Among Ages 25 to 29 years
COMPARE
Immigrants from Singapore
Immigrants from Chile
Unemployment Among Ages 25 to 29 years
Unemployment Among Ages 25 to 29 years Comparison
Immigrants from Singapore
Immigrants from Chile
5.9%
UNEMPLOYMENT AMONG AGES 25 TO 29 YEARS
99.9/ 100
METRIC RATING
18th/ 347
METRIC RANK
6.5%
UNEMPLOYMENT AMONG AGES 25 TO 29 YEARS
80.5/ 100
METRIC RATING
128th/ 347
METRIC RANK
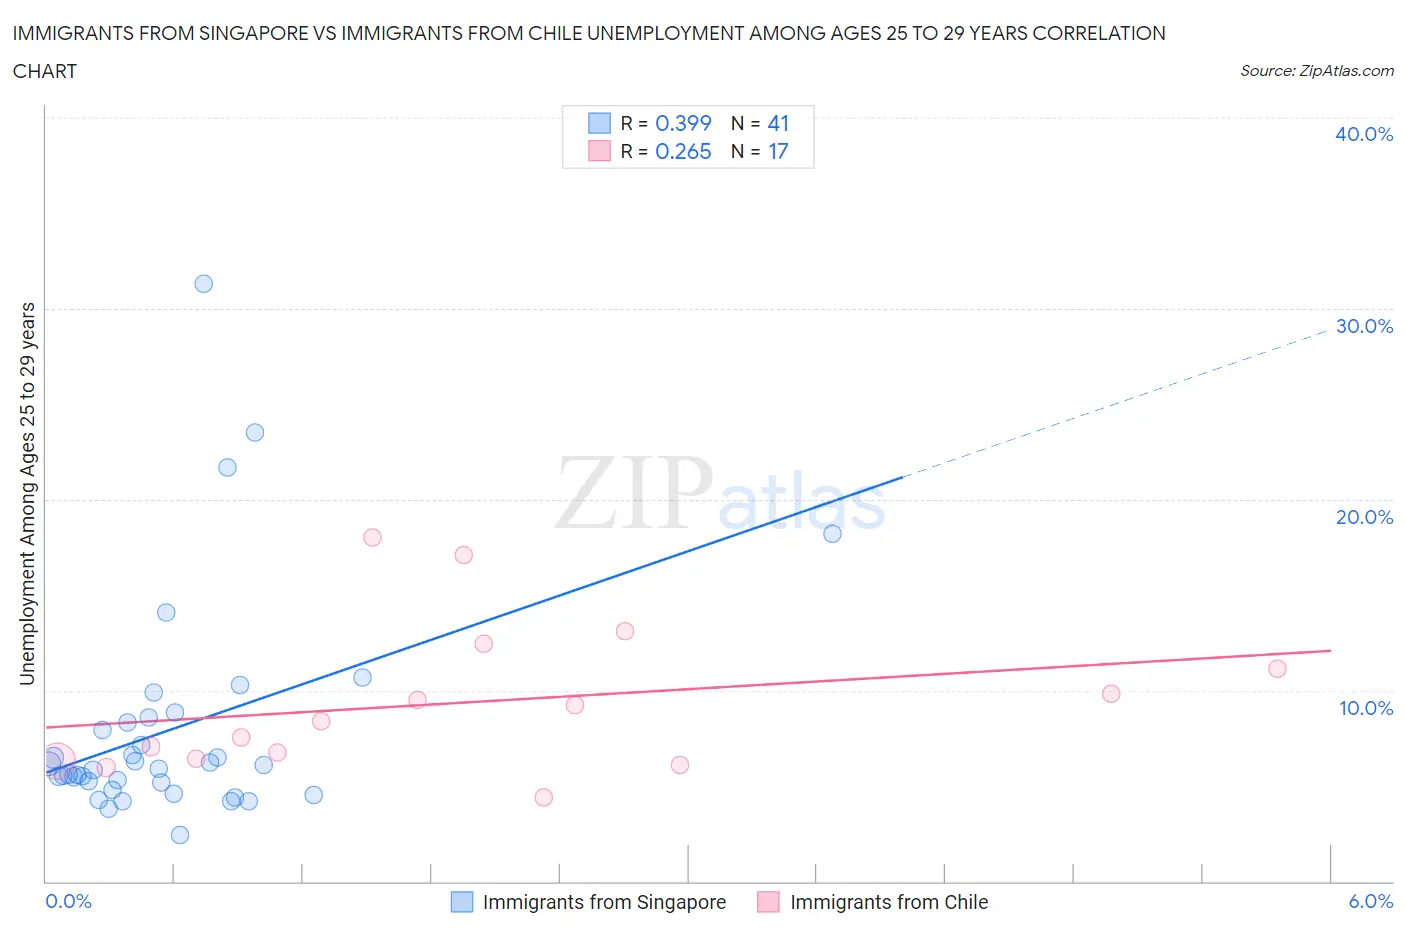
Immigrants from Singapore vs Immigrants from Chile Unemployment Among Ages 25 to 29 years Correlation Chart
The statistical analysis conducted on geographies consisting of 134,874,322 people shows a mild positive correlation between the proportion of Immigrants from Singapore and unemployment rate among population between the ages 25 and 29 in the United States with a correlation coefficient (R) of 0.399 and weighted average of 5.9%. Similarly, the statistical analysis conducted on geographies consisting of 212,936,295 people shows a weak positive correlation between the proportion of Immigrants from Chile and unemployment rate among population between the ages 25 and 29 in the United States with a correlation coefficient (R) of 0.265 and weighted average of 6.5%, a difference of 9.7%.
Unemployment Among Ages 25 to 29 years Correlation Summary
| Measurement | Immigrants from Singapore | Immigrants from Chile |
| Minimum | 2.4% | 4.4% |
| Maximum | 31.3% | 18.0% |
| Range | 28.9% | 13.6% |
| Mean | 8.0% | 9.4% |
| Median | 5.9% | 8.4% |
| Interquartile 25% (IQ1) | 5.0% | 6.3% |
| Interquartile 75% (IQ3) | 8.4% | 11.8% |
| Interquartile Range (IQR) | 3.5% | 5.4% |
| Standard Deviation (Sample) | 5.9% | 3.9% |
| Standard Deviation (Population) | 5.8% | 3.8% |
Similar Demographics by Unemployment Among Ages 25 to 29 years
Demographics Similar to Immigrants from Singapore by Unemployment Among Ages 25 to 29 years
In terms of unemployment among ages 25 to 29 years, the demographic groups most similar to Immigrants from Singapore are Bolivian (5.9%, a difference of 0.11%), Thai (5.9%, a difference of 0.15%), Immigrants from Bulgaria (5.9%, a difference of 0.25%), Cuban (5.9%, a difference of 0.26%), and Immigrants from Eritrea (5.9%, a difference of 0.34%).
| Demographics | Rating | Rank | Unemployment Among Ages 25 to 29 years |
| Cambodians | 100.0 /100 | #11 | Exceptional 5.8% |
| Okinawans | 100.0 /100 | #12 | Exceptional 5.9% |
| Immigrants | Bolivia | 100.0 /100 | #13 | Exceptional 5.9% |
| Immigrants | Kuwait | 99.9 /100 | #14 | Exceptional 5.9% |
| Cubans | 99.9 /100 | #15 | Exceptional 5.9% |
| Immigrants | Bulgaria | 99.9 /100 | #16 | Exceptional 5.9% |
| Bolivians | 99.9 /100 | #17 | Exceptional 5.9% |
| Immigrants | Singapore | 99.9 /100 | #18 | Exceptional 5.9% |
| Thais | 99.9 /100 | #19 | Exceptional 5.9% |
| Immigrants | Eritrea | 99.9 /100 | #20 | Exceptional 5.9% |
| Immigrants | Ethiopia | 99.9 /100 | #21 | Exceptional 6.0% |
| Immigrants | Japan | 99.9 /100 | #22 | Exceptional 6.0% |
| Immigrants | Venezuela | 99.8 /100 | #23 | Exceptional 6.0% |
| Norwegians | 99.8 /100 | #24 | Exceptional 6.0% |
| New Zealanders | 99.8 /100 | #25 | Exceptional 6.0% |
Demographics Similar to Immigrants from Chile by Unemployment Among Ages 25 to 29 years
In terms of unemployment among ages 25 to 29 years, the demographic groups most similar to Immigrants from Chile are Dutch (6.5%, a difference of 0.020%), Sri Lankan (6.5%, a difference of 0.020%), Immigrants from Peru (6.5%, a difference of 0.050%), Immigrants from Afghanistan (6.5%, a difference of 0.13%), and Brazilian (6.5%, a difference of 0.15%).
| Demographics | Rating | Rank | Unemployment Among Ages 25 to 29 years |
| Immigrants | Uganda | 84.5 /100 | #121 | Excellent 6.5% |
| Immigrants | Belarus | 83.7 /100 | #122 | Excellent 6.5% |
| Laotians | 83.6 /100 | #123 | Excellent 6.5% |
| Arabs | 82.5 /100 | #124 | Excellent 6.5% |
| Syrians | 82.1 /100 | #125 | Excellent 6.5% |
| Brazilians | 81.9 /100 | #126 | Excellent 6.5% |
| Dutch | 80.6 /100 | #127 | Excellent 6.5% |
| Immigrants | Chile | 80.5 /100 | #128 | Excellent 6.5% |
| Sri Lankans | 80.3 /100 | #129 | Excellent 6.5% |
| Immigrants | Peru | 79.9 /100 | #130 | Good 6.5% |
| Immigrants | Afghanistan | 79.2 /100 | #131 | Good 6.5% |
| Poles | 76.6 /100 | #132 | Good 6.5% |
| Immigrants | Europe | 75.7 /100 | #133 | Good 6.5% |
| Immigrants | Vietnam | 75.6 /100 | #134 | Good 6.5% |
| Immigrants | Croatia | 75.5 /100 | #135 | Good 6.5% |