Immigrants from Nicaragua vs Immigrants from Chile Unemployment Among Ages 25 to 29 years
COMPARE
Immigrants from Nicaragua
Immigrants from Chile
Unemployment Among Ages 25 to 29 years
Unemployment Among Ages 25 to 29 years Comparison
Immigrants from Nicaragua
Immigrants from Chile
6.4%
UNEMPLOYMENT AMONG AGES 25 TO 29 YEARS
87.5/ 100
METRIC RATING
112th/ 347
METRIC RANK
6.5%
UNEMPLOYMENT AMONG AGES 25 TO 29 YEARS
80.5/ 100
METRIC RATING
128th/ 347
METRIC RANK
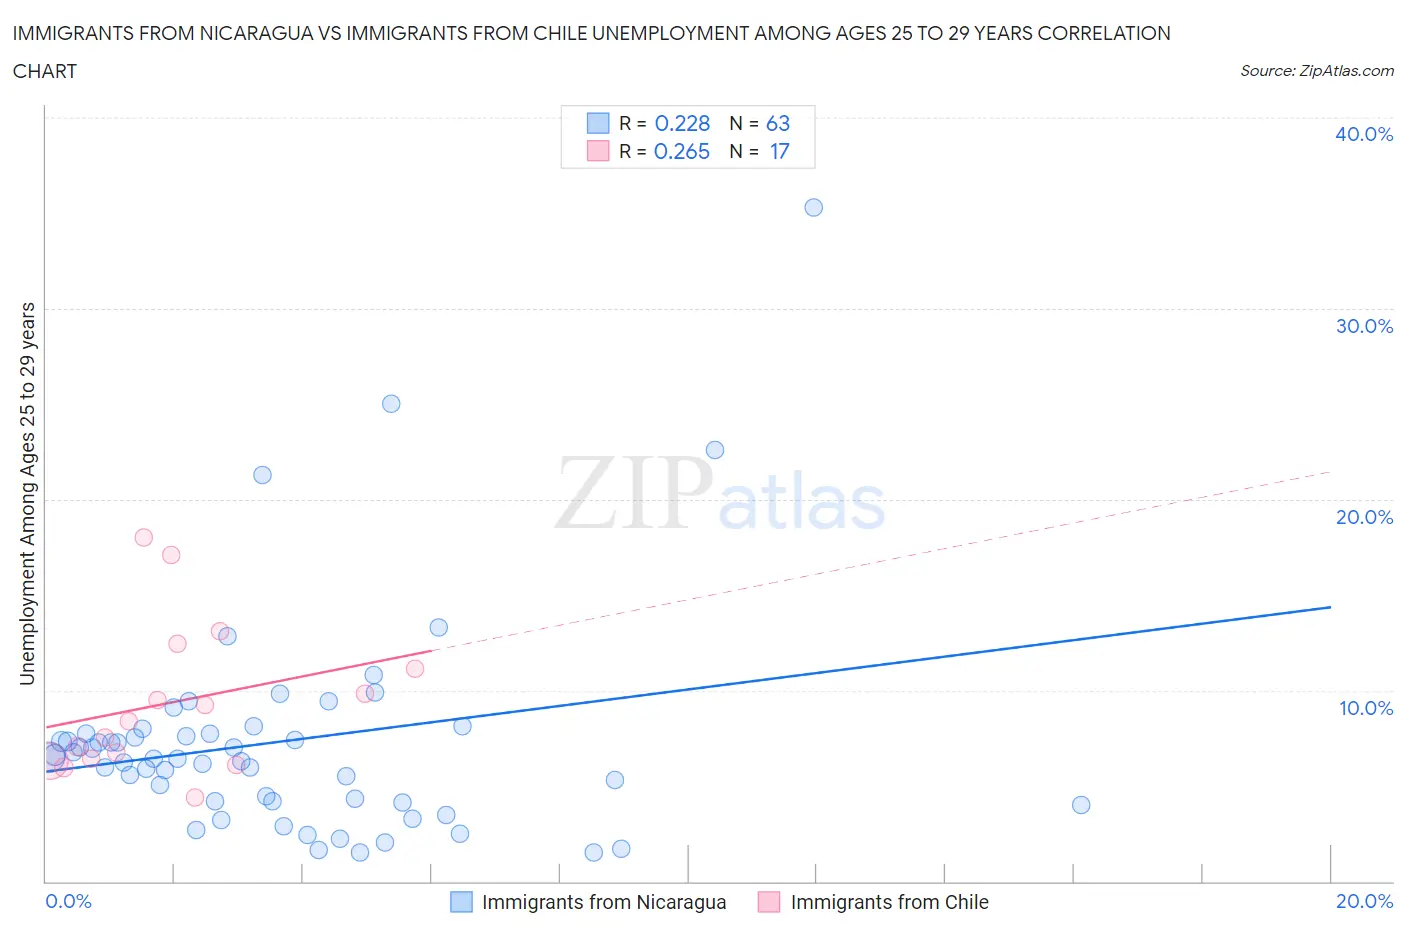
Immigrants from Nicaragua vs Immigrants from Chile Unemployment Among Ages 25 to 29 years Correlation Chart
The statistical analysis conducted on geographies consisting of 231,259,167 people shows a weak positive correlation between the proportion of Immigrants from Nicaragua and unemployment rate among population between the ages 25 and 29 in the United States with a correlation coefficient (R) of 0.228 and weighted average of 6.4%. Similarly, the statistical analysis conducted on geographies consisting of 212,936,295 people shows a weak positive correlation between the proportion of Immigrants from Chile and unemployment rate among population between the ages 25 and 29 in the United States with a correlation coefficient (R) of 0.265 and weighted average of 6.5%, a difference of 0.84%.
Unemployment Among Ages 25 to 29 years Correlation Summary
| Measurement | Immigrants from Nicaragua | Immigrants from Chile |
| Minimum | 1.5% | 4.4% |
| Maximum | 35.3% | 18.0% |
| Range | 33.8% | 13.6% |
| Mean | 7.3% | 9.4% |
| Median | 6.4% | 8.4% |
| Interquartile 25% (IQ1) | 4.2% | 6.3% |
| Interquartile 75% (IQ3) | 7.7% | 11.8% |
| Interquartile Range (IQR) | 3.6% | 5.4% |
| Standard Deviation (Sample) | 5.7% | 3.9% |
| Standard Deviation (Population) | 5.7% | 3.8% |
Demographics Similar to Immigrants from Nicaragua and Immigrants from Chile by Unemployment Among Ages 25 to 29 years
In terms of unemployment among ages 25 to 29 years, the demographic groups most similar to Immigrants from Nicaragua are Immigrants from Colombia (6.4%, a difference of 0.020%), Immigrants from Egypt (6.5%, a difference of 0.050%), European (6.4%, a difference of 0.060%), German (6.5%, a difference of 0.16%), and Macedonian (6.5%, a difference of 0.18%). Similarly, the demographic groups most similar to Immigrants from Chile are Dutch (6.5%, a difference of 0.020%), Sri Lankan (6.5%, a difference of 0.020%), Immigrants from Peru (6.5%, a difference of 0.050%), Brazilian (6.5%, a difference of 0.15%), and Syrian (6.5%, a difference of 0.17%).
| Demographics | Rating | Rank | Unemployment Among Ages 25 to 29 years |
| Europeans | 87.8 /100 | #110 | Excellent 6.4% |
| Immigrants | Colombia | 87.6 /100 | #111 | Excellent 6.4% |
| Immigrants | Nicaragua | 87.5 /100 | #112 | Excellent 6.4% |
| Immigrants | Egypt | 87.1 /100 | #113 | Excellent 6.5% |
| Germans | 86.3 /100 | #114 | Excellent 6.5% |
| Macedonians | 86.1 /100 | #115 | Excellent 6.5% |
| Pakistanis | 85.9 /100 | #116 | Excellent 6.5% |
| Immigrants | Uruguay | 85.7 /100 | #117 | Excellent 6.5% |
| Chileans | 85.3 /100 | #118 | Excellent 6.5% |
| Immigrants | South Africa | 84.9 /100 | #119 | Excellent 6.5% |
| Immigrants | Moldova | 84.5 /100 | #120 | Excellent 6.5% |
| Immigrants | Uganda | 84.5 /100 | #121 | Excellent 6.5% |
| Immigrants | Belarus | 83.7 /100 | #122 | Excellent 6.5% |
| Laotians | 83.6 /100 | #123 | Excellent 6.5% |
| Arabs | 82.5 /100 | #124 | Excellent 6.5% |
| Syrians | 82.1 /100 | #125 | Excellent 6.5% |
| Brazilians | 81.9 /100 | #126 | Excellent 6.5% |
| Dutch | 80.6 /100 | #127 | Excellent 6.5% |
| Immigrants | Chile | 80.5 /100 | #128 | Excellent 6.5% |
| Sri Lankans | 80.3 /100 | #129 | Excellent 6.5% |
| Immigrants | Peru | 79.9 /100 | #130 | Good 6.5% |