Immigrants from Sierra Leone vs Yakama Unemployment Among Women with Children Under 18 years
COMPARE
Immigrants from Sierra Leone
Yakama
Unemployment Among Women with Children Under 18 years
Unemployment Among Women with Children Under 18 years Comparison
Immigrants from Sierra Leone
Yakama
5.8%
UNEMPLOYMENT AMONG WOMEN WITH CHILDREN UNDER 18 YEARS
2.0/ 100
METRIC RATING
239th/ 347
METRIC RANK
8.1%
UNEMPLOYMENT AMONG WOMEN WITH CHILDREN UNDER 18 YEARS
0.0/ 100
METRIC RATING
337th/ 347
METRIC RANK
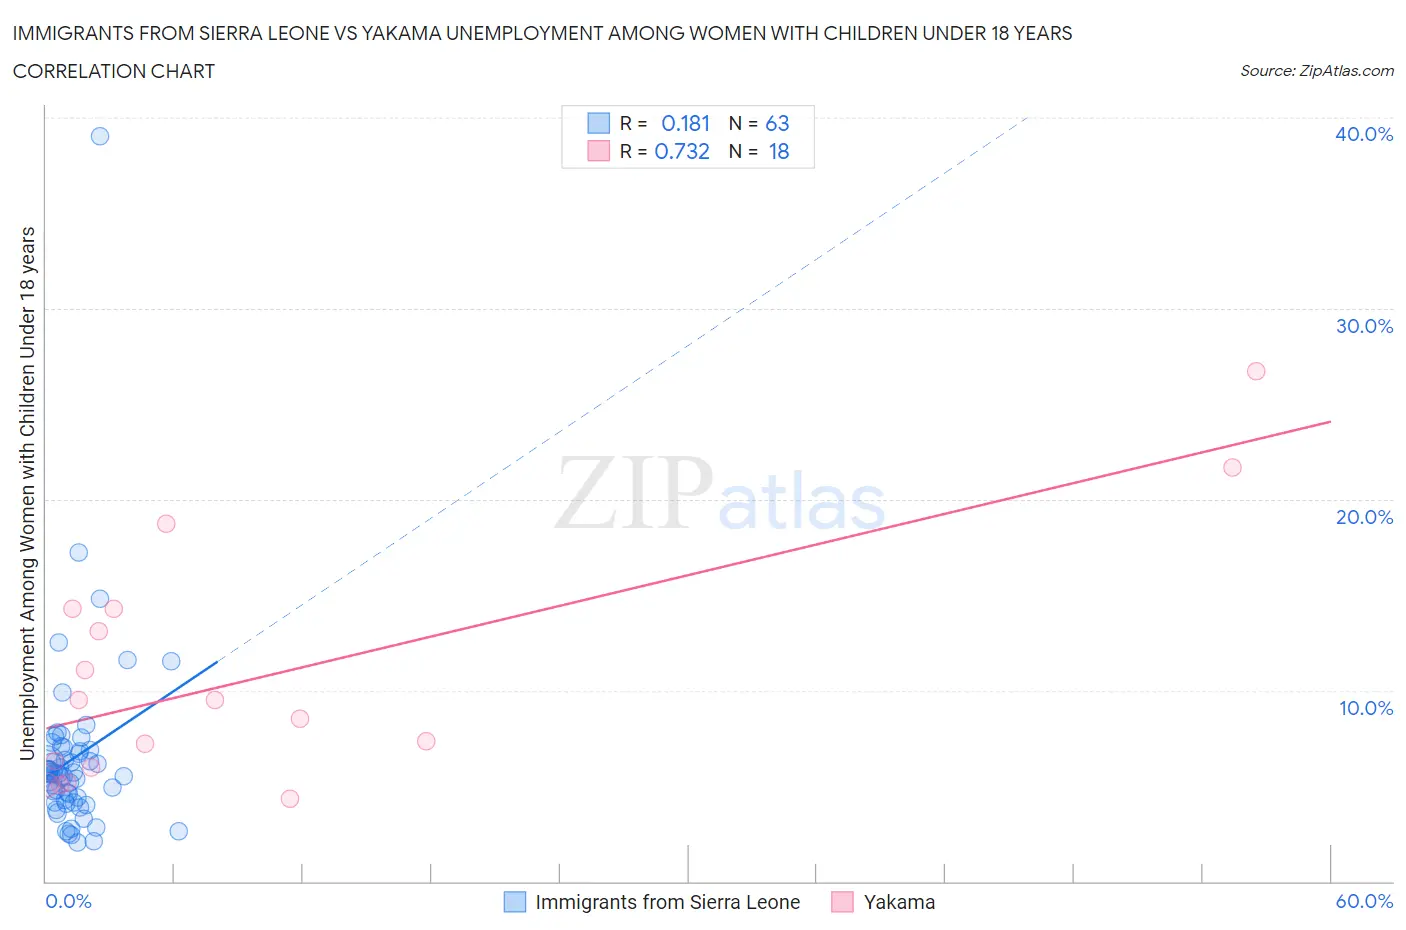
Immigrants from Sierra Leone vs Yakama Unemployment Among Women with Children Under 18 years Correlation Chart
The statistical analysis conducted on geographies consisting of 100,885,825 people shows a poor positive correlation between the proportion of Immigrants from Sierra Leone and unemployment rate among women with children under the age of 18 in the United States with a correlation coefficient (R) of 0.181 and weighted average of 5.8%. Similarly, the statistical analysis conducted on geographies consisting of 19,629,163 people shows a strong positive correlation between the proportion of Yakama and unemployment rate among women with children under the age of 18 in the United States with a correlation coefficient (R) of 0.732 and weighted average of 8.1%, a difference of 38.4%.
Unemployment Among Women with Children Under 18 years Correlation Summary
| Measurement | Immigrants from Sierra Leone | Yakama |
| Minimum | 2.0% | 4.3% |
| Maximum | 39.0% | 26.7% |
| Range | 37.0% | 22.4% |
| Mean | 6.4% | 10.8% |
| Median | 5.7% | 9.0% |
| Interquartile 25% (IQ1) | 4.1% | 6.0% |
| Interquartile 75% (IQ3) | 6.9% | 14.3% |
| Interquartile Range (IQR) | 2.8% | 8.3% |
| Standard Deviation (Sample) | 5.0% | 6.3% |
| Standard Deviation (Population) | 5.0% | 6.2% |
Similar Demographics by Unemployment Among Women with Children Under 18 years
Demographics Similar to Immigrants from Sierra Leone by Unemployment Among Women with Children Under 18 years
In terms of unemployment among women with children under 18 years, the demographic groups most similar to Immigrants from Sierra Leone are Immigrants (5.8%, a difference of 0.0%), Immigrants from Somalia (5.8%, a difference of 0.080%), Immigrants from Lebanon (5.8%, a difference of 0.27%), Alsatian (5.8%, a difference of 0.36%), and Brazilian (5.8%, a difference of 0.47%).
| Demographics | Rating | Rank | Unemployment Among Women with Children Under 18 years |
| Creek | 3.1 /100 | #232 | Tragic 5.8% |
| Spanish Americans | 3.1 /100 | #233 | Tragic 5.8% |
| Guamanians/Chamorros | 2.9 /100 | #234 | Tragic 5.8% |
| Immigrants | Middle Africa | 2.8 /100 | #235 | Tragic 5.8% |
| Alsatians | 2.5 /100 | #236 | Tragic 5.8% |
| Immigrants | Lebanon | 2.4 /100 | #237 | Tragic 5.8% |
| Immigrants | Somalia | 2.2 /100 | #238 | Tragic 5.8% |
| Immigrants | Sierra Leone | 2.0 /100 | #239 | Tragic 5.8% |
| Immigrants | Immigrants | 2.0 /100 | #240 | Tragic 5.8% |
| Brazilians | 1.6 /100 | #241 | Tragic 5.8% |
| Moroccans | 1.4 /100 | #242 | Tragic 5.9% |
| Immigrants | Uruguay | 1.1 /100 | #243 | Tragic 5.9% |
| Choctaw | 1.1 /100 | #244 | Tragic 5.9% |
| Ugandans | 1.1 /100 | #245 | Tragic 5.9% |
| Uruguayans | 1.0 /100 | #246 | Tragic 5.9% |
Demographics Similar to Yakama by Unemployment Among Women with Children Under 18 years
In terms of unemployment among women with children under 18 years, the demographic groups most similar to Yakama are Sioux (7.9%, a difference of 1.4%), Immigrants from Yemen (8.2%, a difference of 1.6%), Apache (7.9%, a difference of 1.7%), Navajo (8.2%, a difference of 2.1%), and Crow (8.2%, a difference of 2.3%).
| Demographics | Rating | Rank | Unemployment Among Women with Children Under 18 years |
| Colville | 0.0 /100 | #330 | Tragic 7.4% |
| Hopi | 0.0 /100 | #331 | Tragic 7.4% |
| Dominicans | 0.0 /100 | #332 | Tragic 7.5% |
| Immigrants | Dominican Republic | 0.0 /100 | #333 | Tragic 7.5% |
| Cheyenne | 0.0 /100 | #334 | Tragic 7.8% |
| Apache | 0.0 /100 | #335 | Tragic 7.9% |
| Sioux | 0.0 /100 | #336 | Tragic 7.9% |
| Yakama | 0.0 /100 | #337 | Tragic 8.1% |
| Immigrants | Yemen | 0.0 /100 | #338 | Tragic 8.2% |
| Navajo | 0.0 /100 | #339 | Tragic 8.2% |
| Crow | 0.0 /100 | #340 | Tragic 8.2% |
| Tohono O'odham | 0.0 /100 | #341 | Tragic 8.9% |
| Puerto Ricans | 0.0 /100 | #342 | Tragic 9.0% |
| Arapaho | 0.0 /100 | #343 | Tragic 9.2% |
| Inupiat | 0.0 /100 | #344 | Tragic 9.6% |