Immigrants from Northern Africa vs Yakama Unemployment Among Women with Children Under 18 years
COMPARE
Immigrants from Northern Africa
Yakama
Unemployment Among Women with Children Under 18 years
Unemployment Among Women with Children Under 18 years Comparison
Immigrants from Northern Africa
Yakama
5.4%
UNEMPLOYMENT AMONG WOMEN WITH CHILDREN UNDER 18 YEARS
56.1/ 100
METRIC RATING
168th/ 347
METRIC RANK
8.1%
UNEMPLOYMENT AMONG WOMEN WITH CHILDREN UNDER 18 YEARS
0.0/ 100
METRIC RATING
337th/ 347
METRIC RANK
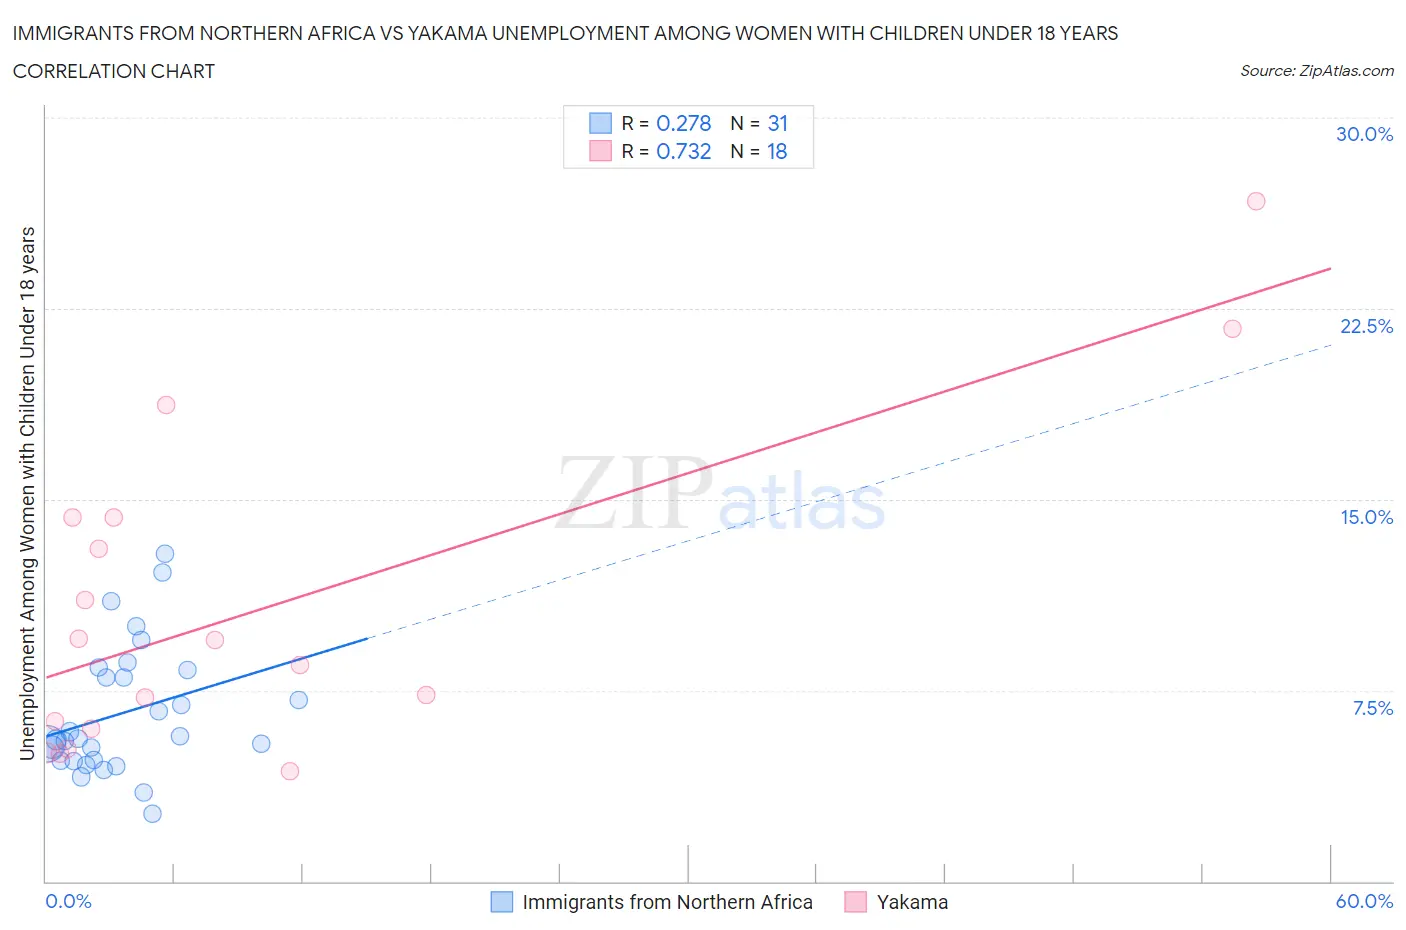
Immigrants from Northern Africa vs Yakama Unemployment Among Women with Children Under 18 years Correlation Chart
The statistical analysis conducted on geographies consisting of 313,241,785 people shows a weak positive correlation between the proportion of Immigrants from Northern Africa and unemployment rate among women with children under the age of 18 in the United States with a correlation coefficient (R) of 0.278 and weighted average of 5.4%. Similarly, the statistical analysis conducted on geographies consisting of 19,629,163 people shows a strong positive correlation between the proportion of Yakama and unemployment rate among women with children under the age of 18 in the United States with a correlation coefficient (R) of 0.732 and weighted average of 8.1%, a difference of 48.5%.
Unemployment Among Women with Children Under 18 years Correlation Summary
| Measurement | Immigrants from Northern Africa | Yakama |
| Minimum | 2.6% | 4.3% |
| Maximum | 12.9% | 26.7% |
| Range | 10.2% | 22.4% |
| Mean | 6.6% | 10.8% |
| Median | 5.6% | 9.0% |
| Interquartile 25% (IQ1) | 4.7% | 6.0% |
| Interquartile 75% (IQ3) | 8.3% | 14.3% |
| Interquartile Range (IQR) | 3.6% | 8.3% |
| Standard Deviation (Sample) | 2.5% | 6.3% |
| Standard Deviation (Population) | 2.5% | 6.2% |
Similar Demographics by Unemployment Among Women with Children Under 18 years
Demographics Similar to Immigrants from Northern Africa by Unemployment Among Women with Children Under 18 years
In terms of unemployment among women with children under 18 years, the demographic groups most similar to Immigrants from Northern Africa are Immigrants from Thailand (5.4%, a difference of 0.060%), Immigrants from Denmark (5.4%, a difference of 0.14%), Samoan (5.4%, a difference of 0.14%), Immigrants from Philippines (5.4%, a difference of 0.21%), and Aleut (5.4%, a difference of 0.24%).
| Demographics | Rating | Rank | Unemployment Among Women with Children Under 18 years |
| Immigrants | Iraq | 65.9 /100 | #161 | Good 5.4% |
| Immigrants | Saudi Arabia | 65.0 /100 | #162 | Good 5.4% |
| Lebanese | 64.7 /100 | #163 | Good 5.4% |
| Celtics | 63.0 /100 | #164 | Good 5.4% |
| Tlingit-Haida | 61.9 /100 | #165 | Good 5.4% |
| Aleuts | 59.4 /100 | #166 | Average 5.4% |
| Immigrants | Denmark | 58.0 /100 | #167 | Average 5.4% |
| Immigrants | Northern Africa | 56.1 /100 | #168 | Average 5.4% |
| Immigrants | Thailand | 55.3 /100 | #169 | Average 5.4% |
| Samoans | 54.1 /100 | #170 | Average 5.4% |
| Immigrants | Philippines | 53.1 /100 | #171 | Average 5.4% |
| Immigrants | Kazakhstan | 51.7 /100 | #172 | Average 5.4% |
| Immigrants | Eastern Africa | 51.3 /100 | #173 | Average 5.4% |
| Immigrants | Uzbekistan | 50.0 /100 | #174 | Average 5.4% |
| Spanish | 49.0 /100 | #175 | Average 5.4% |
Demographics Similar to Yakama by Unemployment Among Women with Children Under 18 years
In terms of unemployment among women with children under 18 years, the demographic groups most similar to Yakama are Sioux (7.9%, a difference of 1.4%), Immigrants from Yemen (8.2%, a difference of 1.6%), Apache (7.9%, a difference of 1.7%), Navajo (8.2%, a difference of 2.1%), and Crow (8.2%, a difference of 2.3%).
| Demographics | Rating | Rank | Unemployment Among Women with Children Under 18 years |
| Colville | 0.0 /100 | #330 | Tragic 7.4% |
| Hopi | 0.0 /100 | #331 | Tragic 7.4% |
| Dominicans | 0.0 /100 | #332 | Tragic 7.5% |
| Immigrants | Dominican Republic | 0.0 /100 | #333 | Tragic 7.5% |
| Cheyenne | 0.0 /100 | #334 | Tragic 7.8% |
| Apache | 0.0 /100 | #335 | Tragic 7.9% |
| Sioux | 0.0 /100 | #336 | Tragic 7.9% |
| Yakama | 0.0 /100 | #337 | Tragic 8.1% |
| Immigrants | Yemen | 0.0 /100 | #338 | Tragic 8.2% |
| Navajo | 0.0 /100 | #339 | Tragic 8.2% |
| Crow | 0.0 /100 | #340 | Tragic 8.2% |
| Tohono O'odham | 0.0 /100 | #341 | Tragic 8.9% |
| Puerto Ricans | 0.0 /100 | #342 | Tragic 9.0% |
| Arapaho | 0.0 /100 | #343 | Tragic 9.2% |
| Inupiat | 0.0 /100 | #344 | Tragic 9.6% |