Immigrants from Sierra Leone vs Nigerian Unemployment Among Ages 25 to 29 years
COMPARE
Immigrants from Sierra Leone
Nigerian
Unemployment Among Ages 25 to 29 years
Unemployment Among Ages 25 to 29 years Comparison
Immigrants from Sierra Leone
Nigerians
7.1%
UNEMPLOYMENT AMONG AGES 25 TO 29 YEARS
1.3/ 100
METRIC RATING
241st/ 347
METRIC RANK
7.4%
UNEMPLOYMENT AMONG AGES 25 TO 29 YEARS
0.1/ 100
METRIC RATING
261st/ 347
METRIC RANK
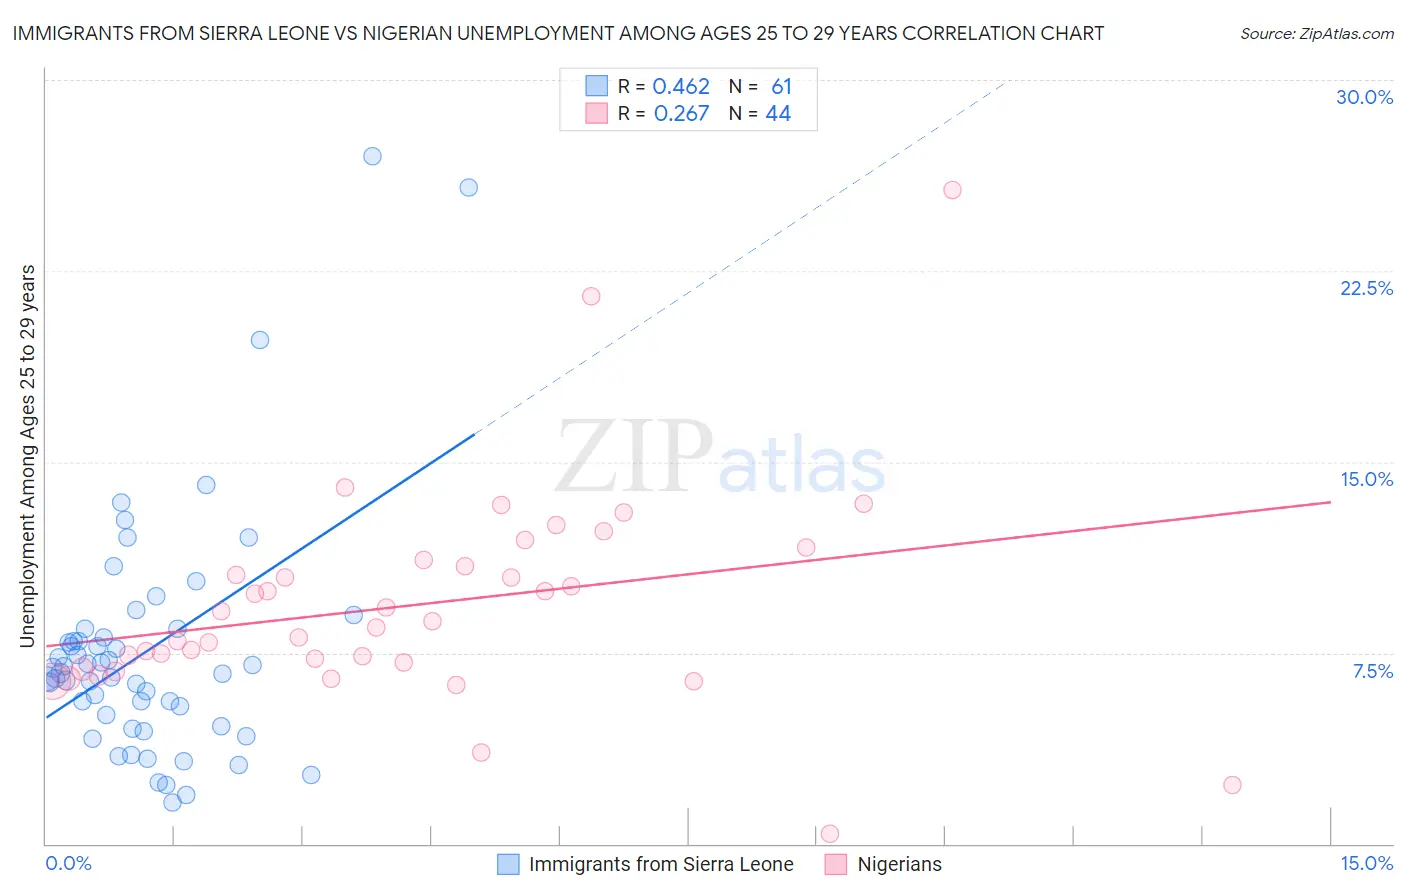
Immigrants from Sierra Leone vs Nigerian Unemployment Among Ages 25 to 29 years Correlation Chart
The statistical analysis conducted on geographies consisting of 100,822,956 people shows a moderate positive correlation between the proportion of Immigrants from Sierra Leone and unemployment rate among population between the ages 25 and 29 in the United States with a correlation coefficient (R) of 0.462 and weighted average of 7.1%. Similarly, the statistical analysis conducted on geographies consisting of 322,821,029 people shows a weak positive correlation between the proportion of Nigerians and unemployment rate among population between the ages 25 and 29 in the United States with a correlation coefficient (R) of 0.267 and weighted average of 7.4%, a difference of 4.0%.
Unemployment Among Ages 25 to 29 years Correlation Summary
| Measurement | Immigrants from Sierra Leone | Nigerian |
| Minimum | 1.6% | 0.40% |
| Maximum | 27.0% | 25.7% |
| Range | 25.4% | 25.3% |
| Mean | 7.6% | 9.4% |
| Median | 6.7% | 8.6% |
| Interquartile 25% (IQ1) | 4.8% | 7.0% |
| Interquartile 75% (IQ3) | 8.3% | 11.0% |
| Interquartile Range (IQR) | 3.4% | 4.1% |
| Standard Deviation (Sample) | 4.8% | 4.3% |
| Standard Deviation (Population) | 4.7% | 4.2% |
Demographics Similar to Immigrants from Sierra Leone and Nigerians by Unemployment Among Ages 25 to 29 years
In terms of unemployment among ages 25 to 29 years, the demographic groups most similar to Immigrants from Sierra Leone are Spanish American Indian (7.1%, a difference of 0.26%), Yaqui (7.1%, a difference of 0.39%), Nonimmigrants (7.1%, a difference of 0.43%), Guatemalan (7.1%, a difference of 0.52%), and Immigrants from Uzbekistan (7.2%, a difference of 0.92%). Similarly, the demographic groups most similar to Nigerians are American (7.4%, a difference of 0.080%), Cree (7.3%, a difference of 0.61%), Ottawa (7.3%, a difference of 0.82%), Assyrian/Chaldean/Syriac (7.3%, a difference of 1.2%), and Mexican American Indian (7.3%, a difference of 1.6%).
| Demographics | Rating | Rank | Unemployment Among Ages 25 to 29 years |
| Immigrants | Sierra Leone | 1.3 /100 | #241 | Tragic 7.1% |
| Spanish American Indians | 1.1 /100 | #242 | Tragic 7.1% |
| Yaqui | 1.0 /100 | #243 | Tragic 7.1% |
| Immigrants | Nonimmigrants | 0.9 /100 | #244 | Tragic 7.1% |
| Guatemalans | 0.9 /100 | #245 | Tragic 7.1% |
| Immigrants | Uzbekistan | 0.7 /100 | #246 | Tragic 7.2% |
| Immigrants | Guatemala | 0.7 /100 | #247 | Tragic 7.2% |
| Sub-Saharan Africans | 0.6 /100 | #248 | Tragic 7.2% |
| Seminole | 0.6 /100 | #249 | Tragic 7.2% |
| Delaware | 0.5 /100 | #250 | Tragic 7.2% |
| Portuguese | 0.5 /100 | #251 | Tragic 7.2% |
| Sierra Leoneans | 0.4 /100 | #252 | Tragic 7.2% |
| Immigrants | Portugal | 0.3 /100 | #253 | Tragic 7.2% |
| Ghanaians | 0.3 /100 | #254 | Tragic 7.2% |
| Immigrants | Cameroon | 0.3 /100 | #255 | Tragic 7.2% |
| Mexican American Indians | 0.3 /100 | #256 | Tragic 7.3% |
| Assyrians/Chaldeans/Syriacs | 0.2 /100 | #257 | Tragic 7.3% |
| Ottawa | 0.1 /100 | #258 | Tragic 7.3% |
| Cree | 0.1 /100 | #259 | Tragic 7.3% |
| Americans | 0.1 /100 | #260 | Tragic 7.4% |
| Nigerians | 0.1 /100 | #261 | Tragic 7.4% |