Immigrants from Sierra Leone vs American Unemployment Among Ages 25 to 29 years
COMPARE
Immigrants from Sierra Leone
American
Unemployment Among Ages 25 to 29 years
Unemployment Among Ages 25 to 29 years Comparison
Immigrants from Sierra Leone
Americans
7.1%
UNEMPLOYMENT AMONG AGES 25 TO 29 YEARS
1.3/ 100
METRIC RATING
241st/ 347
METRIC RANK
7.4%
UNEMPLOYMENT AMONG AGES 25 TO 29 YEARS
0.1/ 100
METRIC RATING
260th/ 347
METRIC RANK
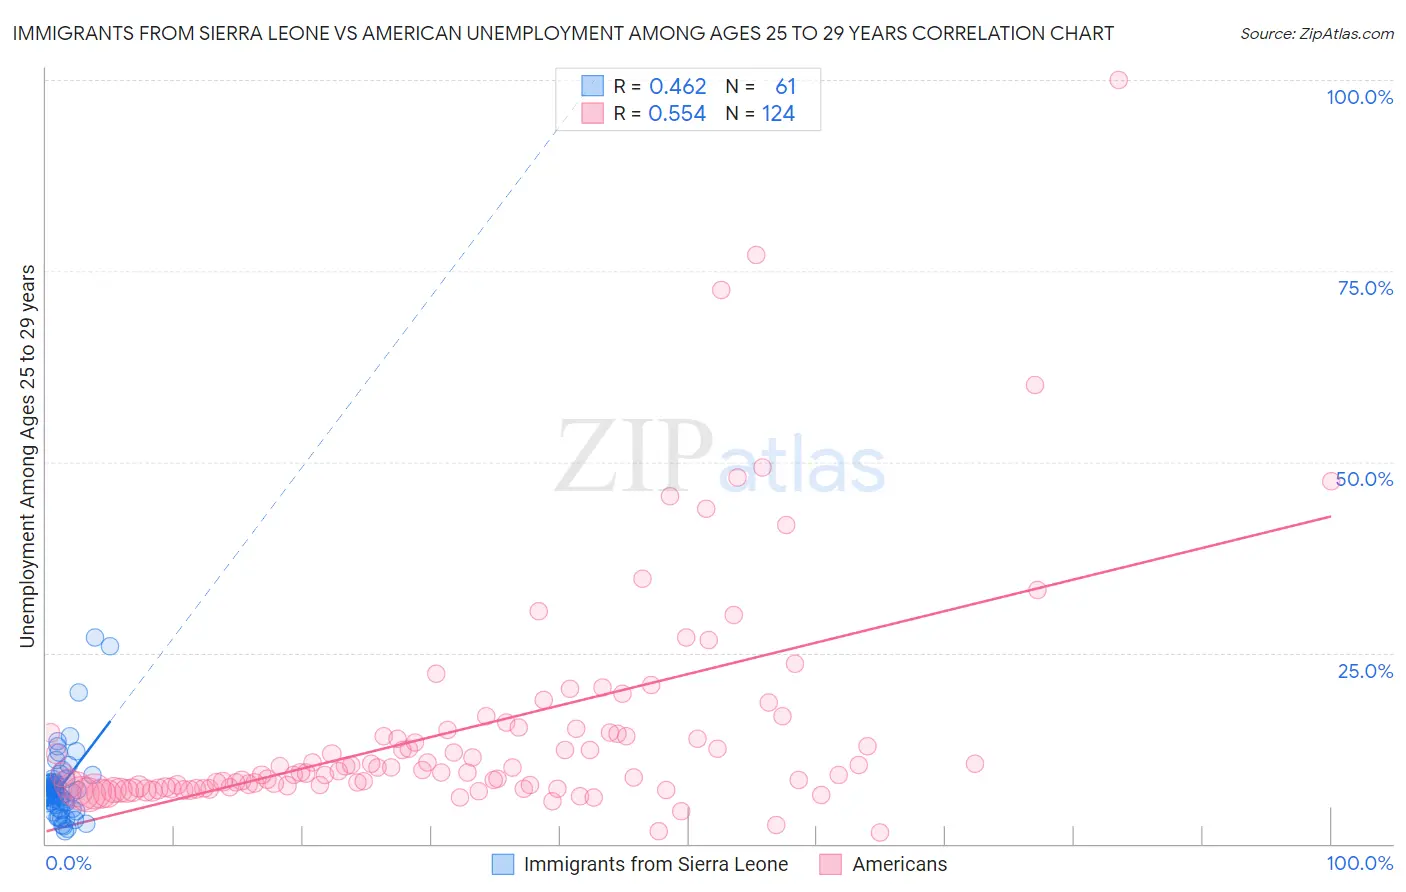
Immigrants from Sierra Leone vs American Unemployment Among Ages 25 to 29 years Correlation Chart
The statistical analysis conducted on geographies consisting of 100,822,956 people shows a moderate positive correlation between the proportion of Immigrants from Sierra Leone and unemployment rate among population between the ages 25 and 29 in the United States with a correlation coefficient (R) of 0.462 and weighted average of 7.1%. Similarly, the statistical analysis conducted on geographies consisting of 512,790,797 people shows a substantial positive correlation between the proportion of Americans and unemployment rate among population between the ages 25 and 29 in the United States with a correlation coefficient (R) of 0.554 and weighted average of 7.4%, a difference of 3.9%.
Unemployment Among Ages 25 to 29 years Correlation Summary
| Measurement | Immigrants from Sierra Leone | American |
| Minimum | 1.6% | 1.5% |
| Maximum | 27.0% | 100.0% |
| Range | 25.4% | 98.5% |
| Mean | 7.6% | 14.9% |
| Median | 6.7% | 9.4% |
| Interquartile 25% (IQ1) | 4.8% | 7.3% |
| Interquartile 75% (IQ3) | 8.3% | 14.6% |
| Interquartile Range (IQR) | 3.4% | 7.3% |
| Standard Deviation (Sample) | 4.8% | 15.1% |
| Standard Deviation (Population) | 4.7% | 15.1% |
Demographics Similar to Immigrants from Sierra Leone and Americans by Unemployment Among Ages 25 to 29 years
In terms of unemployment among ages 25 to 29 years, the demographic groups most similar to Immigrants from Sierra Leone are Native Hawaiian (7.1%, a difference of 0.040%), Spanish American Indian (7.1%, a difference of 0.26%), Yaqui (7.1%, a difference of 0.39%), Nonimmigrants (7.1%, a difference of 0.43%), and Guatemalan (7.1%, a difference of 0.52%). Similarly, the demographic groups most similar to Americans are Cree (7.3%, a difference of 0.53%), Ottawa (7.3%, a difference of 0.74%), Assyrian/Chaldean/Syriac (7.3%, a difference of 1.1%), Mexican American Indian (7.3%, a difference of 1.5%), and Immigrants from Cameroon (7.2%, a difference of 1.7%).
| Demographics | Rating | Rank | Unemployment Among Ages 25 to 29 years |
| Native Hawaiians | 1.3 /100 | #240 | Tragic 7.1% |
| Immigrants | Sierra Leone | 1.3 /100 | #241 | Tragic 7.1% |
| Spanish American Indians | 1.1 /100 | #242 | Tragic 7.1% |
| Yaqui | 1.0 /100 | #243 | Tragic 7.1% |
| Immigrants | Nonimmigrants | 0.9 /100 | #244 | Tragic 7.1% |
| Guatemalans | 0.9 /100 | #245 | Tragic 7.1% |
| Immigrants | Uzbekistan | 0.7 /100 | #246 | Tragic 7.2% |
| Immigrants | Guatemala | 0.7 /100 | #247 | Tragic 7.2% |
| Sub-Saharan Africans | 0.6 /100 | #248 | Tragic 7.2% |
| Seminole | 0.6 /100 | #249 | Tragic 7.2% |
| Delaware | 0.5 /100 | #250 | Tragic 7.2% |
| Portuguese | 0.5 /100 | #251 | Tragic 7.2% |
| Sierra Leoneans | 0.4 /100 | #252 | Tragic 7.2% |
| Immigrants | Portugal | 0.3 /100 | #253 | Tragic 7.2% |
| Ghanaians | 0.3 /100 | #254 | Tragic 7.2% |
| Immigrants | Cameroon | 0.3 /100 | #255 | Tragic 7.2% |
| Mexican American Indians | 0.3 /100 | #256 | Tragic 7.3% |
| Assyrians/Chaldeans/Syriacs | 0.2 /100 | #257 | Tragic 7.3% |
| Ottawa | 0.1 /100 | #258 | Tragic 7.3% |
| Cree | 0.1 /100 | #259 | Tragic 7.3% |
| Americans | 0.1 /100 | #260 | Tragic 7.4% |