Immigrants from Serbia vs Immigrants from Yemen Unemployment Among Ages 60 to 64 years
COMPARE
Immigrants from Serbia
Immigrants from Yemen
Unemployment Among Ages 60 to 64 years
Unemployment Among Ages 60 to 64 years Comparison
Immigrants from Serbia
Immigrants from Yemen
4.8%
UNEMPLOYMENT AMONG AGES 60 TO 64 YEARS
90.2/ 100
METRIC RATING
129th/ 347
METRIC RANK
6.8%
UNEMPLOYMENT AMONG AGES 60 TO 64 YEARS
0.0/ 100
METRIC RATING
343rd/ 347
METRIC RANK
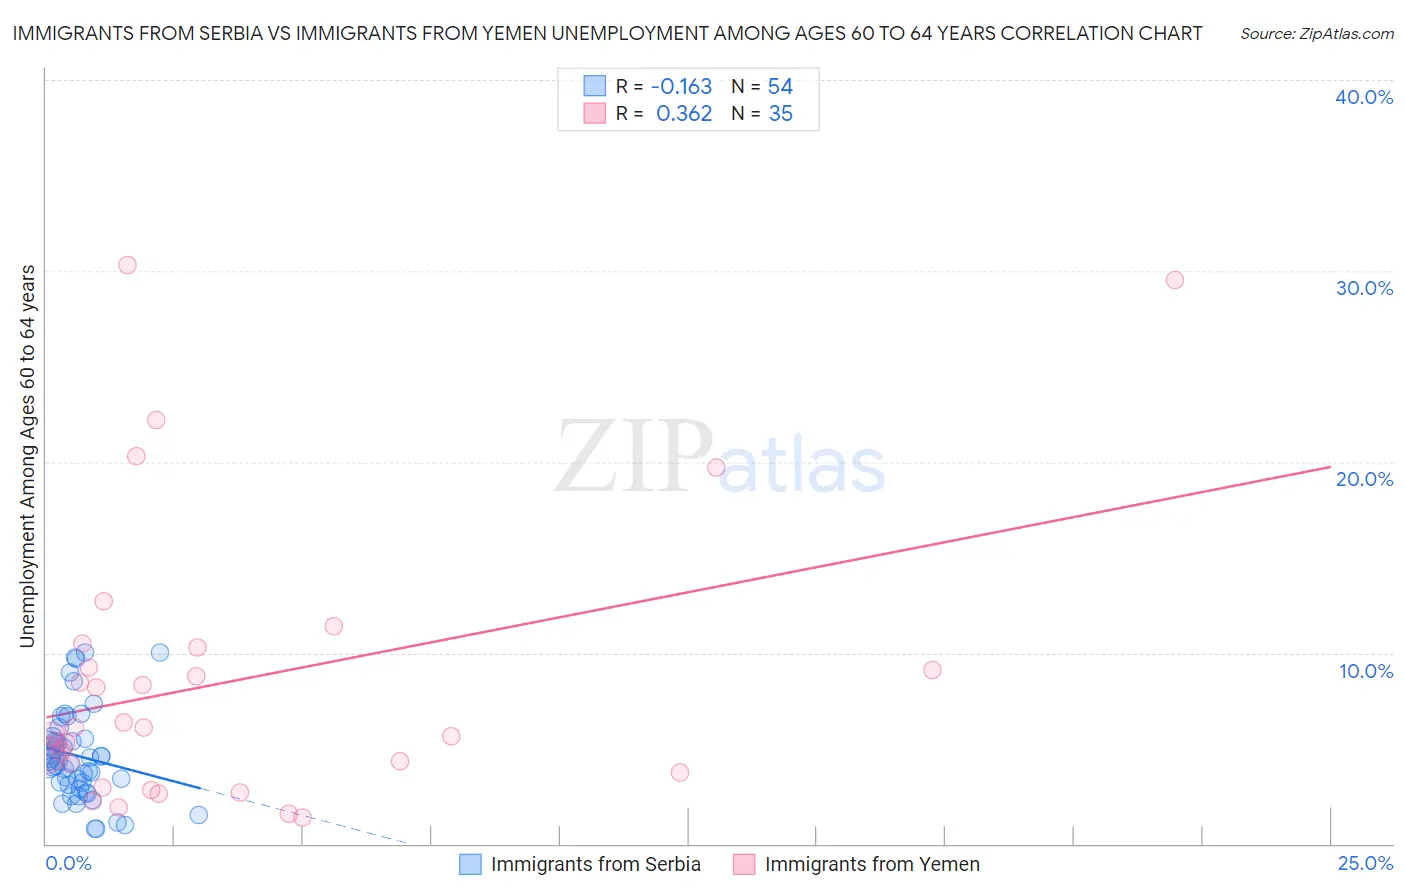
Immigrants from Serbia vs Immigrants from Yemen Unemployment Among Ages 60 to 64 years Correlation Chart
The statistical analysis conducted on geographies consisting of 127,025,740 people shows a poor negative correlation between the proportion of Immigrants from Serbia and unemployment rate among population between the ages 60 and 64 in the United States with a correlation coefficient (R) of -0.163 and weighted average of 4.8%. Similarly, the statistical analysis conducted on geographies consisting of 80,522,471 people shows a mild positive correlation between the proportion of Immigrants from Yemen and unemployment rate among population between the ages 60 and 64 in the United States with a correlation coefficient (R) of 0.362 and weighted average of 6.8%, a difference of 43.3%.
Unemployment Among Ages 60 to 64 years Correlation Summary
| Measurement | Immigrants from Serbia | Immigrants from Yemen |
| Minimum | 0.80% | 1.4% |
| Maximum | 10.0% | 30.3% |
| Range | 9.2% | 28.9% |
| Mean | 4.6% | 8.6% |
| Median | 4.3% | 6.1% |
| Interquartile 25% (IQ1) | 3.1% | 3.7% |
| Interquartile 75% (IQ3) | 5.5% | 10.3% |
| Interquartile Range (IQR) | 2.4% | 6.6% |
| Standard Deviation (Sample) | 2.3% | 7.4% |
| Standard Deviation (Population) | 2.3% | 7.3% |
Similar Demographics by Unemployment Among Ages 60 to 64 years
Demographics Similar to Immigrants from Serbia by Unemployment Among Ages 60 to 64 years
In terms of unemployment among ages 60 to 64 years, the demographic groups most similar to Immigrants from Serbia are Choctaw (4.8%, a difference of 0.010%), Immigrants from Syria (4.8%, a difference of 0.010%), Immigrants from Lebanon (4.8%, a difference of 0.060%), Lithuanian (4.8%, a difference of 0.070%), and Yaqui (4.8%, a difference of 0.080%).
| Demographics | Rating | Rank | Unemployment Among Ages 60 to 64 years |
| Immigrants | Kazakhstan | 95.1 /100 | #122 | Exceptional 4.7% |
| Finns | 94.7 /100 | #123 | Exceptional 4.7% |
| Immigrants | Senegal | 94.5 /100 | #124 | Exceptional 4.7% |
| Immigrants | Thailand | 93.7 /100 | #125 | Exceptional 4.7% |
| Immigrants | South Central Asia | 93.0 /100 | #126 | Exceptional 4.7% |
| Austrians | 91.9 /100 | #127 | Exceptional 4.8% |
| Choctaw | 90.3 /100 | #128 | Exceptional 4.8% |
| Immigrants | Serbia | 90.2 /100 | #129 | Exceptional 4.8% |
| Immigrants | Syria | 90.1 /100 | #130 | Exceptional 4.8% |
| Immigrants | Lebanon | 89.6 /100 | #131 | Excellent 4.8% |
| Lithuanians | 89.6 /100 | #132 | Excellent 4.8% |
| Yaqui | 89.5 /100 | #133 | Excellent 4.8% |
| Basques | 88.8 /100 | #134 | Excellent 4.8% |
| Pennsylvania Germans | 87.8 /100 | #135 | Excellent 4.8% |
| French Canadians | 87.6 /100 | #136 | Excellent 4.8% |
Demographics Similar to Immigrants from Yemen by Unemployment Among Ages 60 to 64 years
In terms of unemployment among ages 60 to 64 years, the demographic groups most similar to Immigrants from Yemen are Aleut (6.8%, a difference of 0.72%), Yuman (6.8%, a difference of 0.73%), Pueblo (6.7%, a difference of 1.3%), Tlingit-Haida (6.4%, a difference of 6.9%), and Arapaho (6.3%, a difference of 8.4%).
| Demographics | Rating | Rank | Unemployment Among Ages 60 to 64 years |
| Immigrants | Dominican Republic | 0.0 /100 | #333 | Tragic 6.0% |
| Puerto Ricans | 0.0 /100 | #334 | Tragic 6.1% |
| Vietnamese | 0.0 /100 | #335 | Tragic 6.1% |
| Kiowa | 0.0 /100 | #336 | Tragic 6.2% |
| Navajo | 0.0 /100 | #337 | Tragic 6.3% |
| Arapaho | 0.0 /100 | #338 | Tragic 6.3% |
| Tlingit-Haida | 0.0 /100 | #339 | Tragic 6.4% |
| Pueblo | 0.0 /100 | #340 | Tragic 6.7% |
| Yuman | 0.0 /100 | #341 | Tragic 6.8% |
| Aleuts | 0.0 /100 | #342 | Tragic 6.8% |
| Immigrants | Yemen | 0.0 /100 | #343 | Tragic 6.8% |
| Alaska Natives | 0.0 /100 | #344 | Tragic 7.6% |
| Alaskan Athabascans | 0.0 /100 | #345 | Tragic 8.4% |
| Inupiat | 0.0 /100 | #346 | Tragic 9.6% |
| Yup'ik | 0.0 /100 | #347 | Tragic 11.9% |