Colville vs Immigrants from Yemen Unemployment Among Ages 60 to 64 years
COMPARE
Colville
Immigrants from Yemen
Unemployment Among Ages 60 to 64 years
Unemployment Among Ages 60 to 64 years Comparison
Colville
Immigrants from Yemen
5.7%
UNEMPLOYMENT AMONG AGES 60 TO 64 YEARS
0.0/ 100
METRIC RATING
320th/ 347
METRIC RANK
6.8%
UNEMPLOYMENT AMONG AGES 60 TO 64 YEARS
0.0/ 100
METRIC RATING
343rd/ 347
METRIC RANK
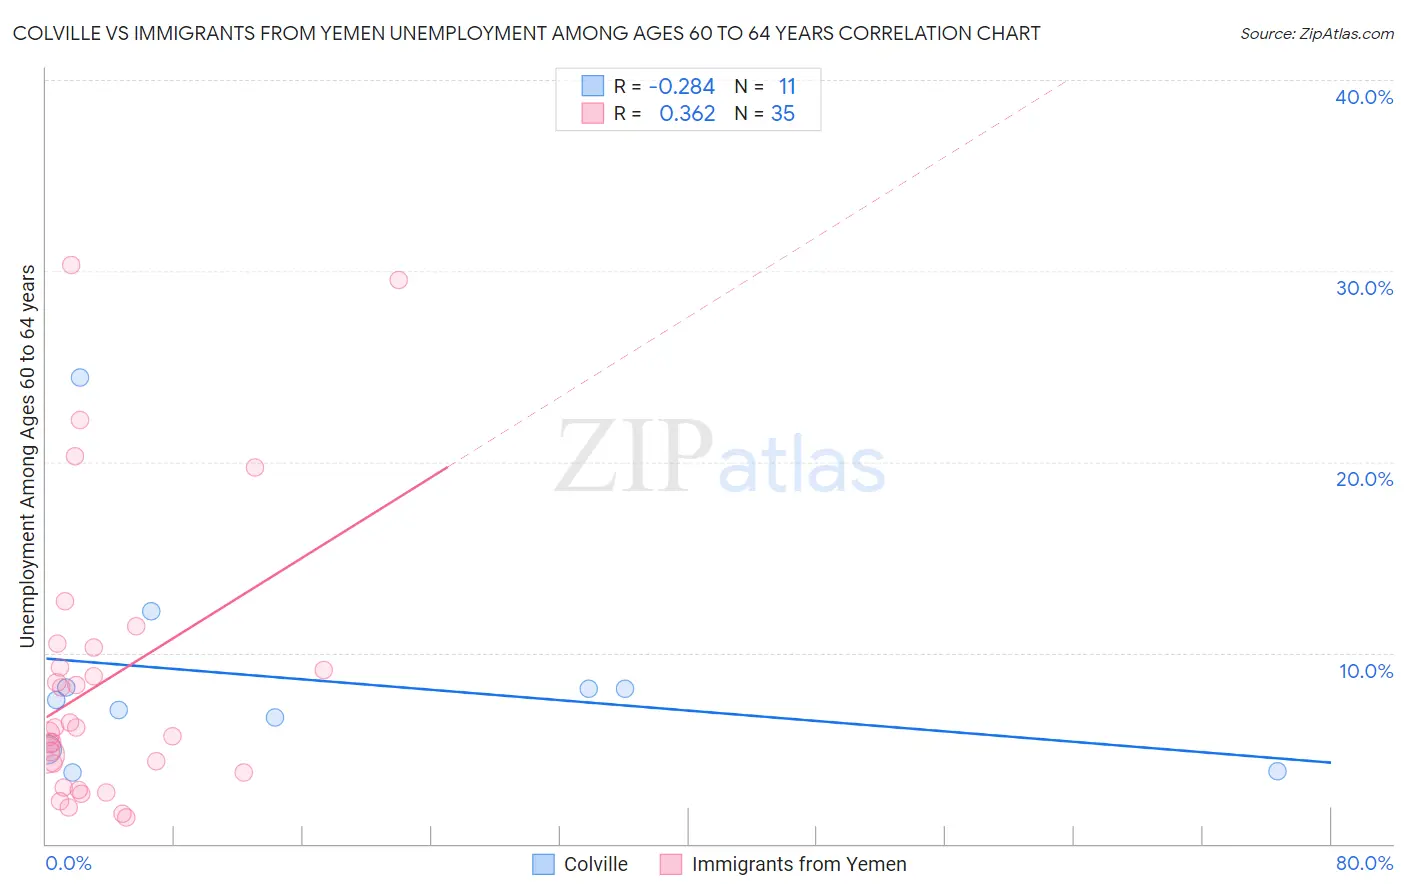
Colville vs Immigrants from Yemen Unemployment Among Ages 60 to 64 years Correlation Chart
The statistical analysis conducted on geographies consisting of 33,432,651 people shows a weak negative correlation between the proportion of Colville and unemployment rate among population between the ages 60 and 64 in the United States with a correlation coefficient (R) of -0.284 and weighted average of 5.7%. Similarly, the statistical analysis conducted on geographies consisting of 80,522,471 people shows a mild positive correlation between the proportion of Immigrants from Yemen and unemployment rate among population between the ages 60 and 64 in the United States with a correlation coefficient (R) of 0.362 and weighted average of 6.8%, a difference of 19.1%.
Unemployment Among Ages 60 to 64 years Correlation Summary
| Measurement | Colville | Immigrants from Yemen |
| Minimum | 3.7% | 1.4% |
| Maximum | 24.4% | 30.3% |
| Range | 20.7% | 28.9% |
| Mean | 8.6% | 8.6% |
| Median | 7.6% | 6.1% |
| Interquartile 25% (IQ1) | 4.9% | 3.7% |
| Interquartile 75% (IQ3) | 8.2% | 10.3% |
| Interquartile Range (IQR) | 3.3% | 6.6% |
| Standard Deviation (Sample) | 5.8% | 7.4% |
| Standard Deviation (Population) | 5.5% | 7.3% |
Similar Demographics by Unemployment Among Ages 60 to 64 years
Demographics Similar to Colville by Unemployment Among Ages 60 to 64 years
In terms of unemployment among ages 60 to 64 years, the demographic groups most similar to Colville are Dutch West Indian (5.7%, a difference of 0.050%), Ecuadorian (5.8%, a difference of 0.44%), Immigrants from Belize (5.7%, a difference of 0.77%), Alsatian (5.8%, a difference of 1.1%), and Native/Alaskan (5.7%, a difference of 1.3%).
| Demographics | Rating | Rank | Unemployment Among Ages 60 to 64 years |
| Belizeans | 0.0 /100 | #313 | Tragic 5.5% |
| Guyanese | 0.0 /100 | #314 | Tragic 5.5% |
| Cree | 0.0 /100 | #315 | Tragic 5.6% |
| Cheyenne | 0.0 /100 | #316 | Tragic 5.6% |
| Shoshone | 0.0 /100 | #317 | Tragic 5.7% |
| Natives/Alaskans | 0.0 /100 | #318 | Tragic 5.7% |
| Immigrants | Belize | 0.0 /100 | #319 | Tragic 5.7% |
| Colville | 0.0 /100 | #320 | Tragic 5.7% |
| Dutch West Indians | 0.0 /100 | #321 | Tragic 5.7% |
| Ecuadorians | 0.0 /100 | #322 | Tragic 5.8% |
| Alsatians | 0.0 /100 | #323 | Tragic 5.8% |
| Immigrants | Ecuador | 0.0 /100 | #324 | Tragic 5.8% |
| Paiute | 0.0 /100 | #325 | Tragic 5.8% |
| Immigrants | St. Vincent and the Grenadines | 0.0 /100 | #326 | Tragic 5.9% |
| Immigrants | Grenada | 0.0 /100 | #327 | Tragic 5.9% |
Demographics Similar to Immigrants from Yemen by Unemployment Among Ages 60 to 64 years
In terms of unemployment among ages 60 to 64 years, the demographic groups most similar to Immigrants from Yemen are Aleut (6.8%, a difference of 0.72%), Yuman (6.8%, a difference of 0.73%), Pueblo (6.7%, a difference of 1.3%), Tlingit-Haida (6.4%, a difference of 6.9%), and Arapaho (6.3%, a difference of 8.4%).
| Demographics | Rating | Rank | Unemployment Among Ages 60 to 64 years |
| Immigrants | Dominican Republic | 0.0 /100 | #333 | Tragic 6.0% |
| Puerto Ricans | 0.0 /100 | #334 | Tragic 6.1% |
| Vietnamese | 0.0 /100 | #335 | Tragic 6.1% |
| Kiowa | 0.0 /100 | #336 | Tragic 6.2% |
| Navajo | 0.0 /100 | #337 | Tragic 6.3% |
| Arapaho | 0.0 /100 | #338 | Tragic 6.3% |
| Tlingit-Haida | 0.0 /100 | #339 | Tragic 6.4% |
| Pueblo | 0.0 /100 | #340 | Tragic 6.7% |
| Yuman | 0.0 /100 | #341 | Tragic 6.8% |
| Aleuts | 0.0 /100 | #342 | Tragic 6.8% |
| Immigrants | Yemen | 0.0 /100 | #343 | Tragic 6.8% |
| Alaska Natives | 0.0 /100 | #344 | Tragic 7.6% |
| Alaskan Athabascans | 0.0 /100 | #345 | Tragic 8.4% |
| Inupiat | 0.0 /100 | #346 | Tragic 9.6% |
| Yup'ik | 0.0 /100 | #347 | Tragic 11.9% |