Immigrants from Senegal vs Immigrants from England Unemployment Among Women with Children Under 6 years
COMPARE
Immigrants from Senegal
Immigrants from England
Unemployment Among Women with Children Under 6 years
Unemployment Among Women with Children Under 6 years Comparison
Immigrants from Senegal
Immigrants from England
8.5%
UNEMPLOYMENT AMONG WOMEN WITH CHILDREN UNDER 6 YEARS
0.2/ 100
METRIC RATING
270th/ 347
METRIC RANK
7.7%
UNEMPLOYMENT AMONG WOMEN WITH CHILDREN UNDER 6 YEARS
45.4/ 100
METRIC RATING
178th/ 347
METRIC RANK
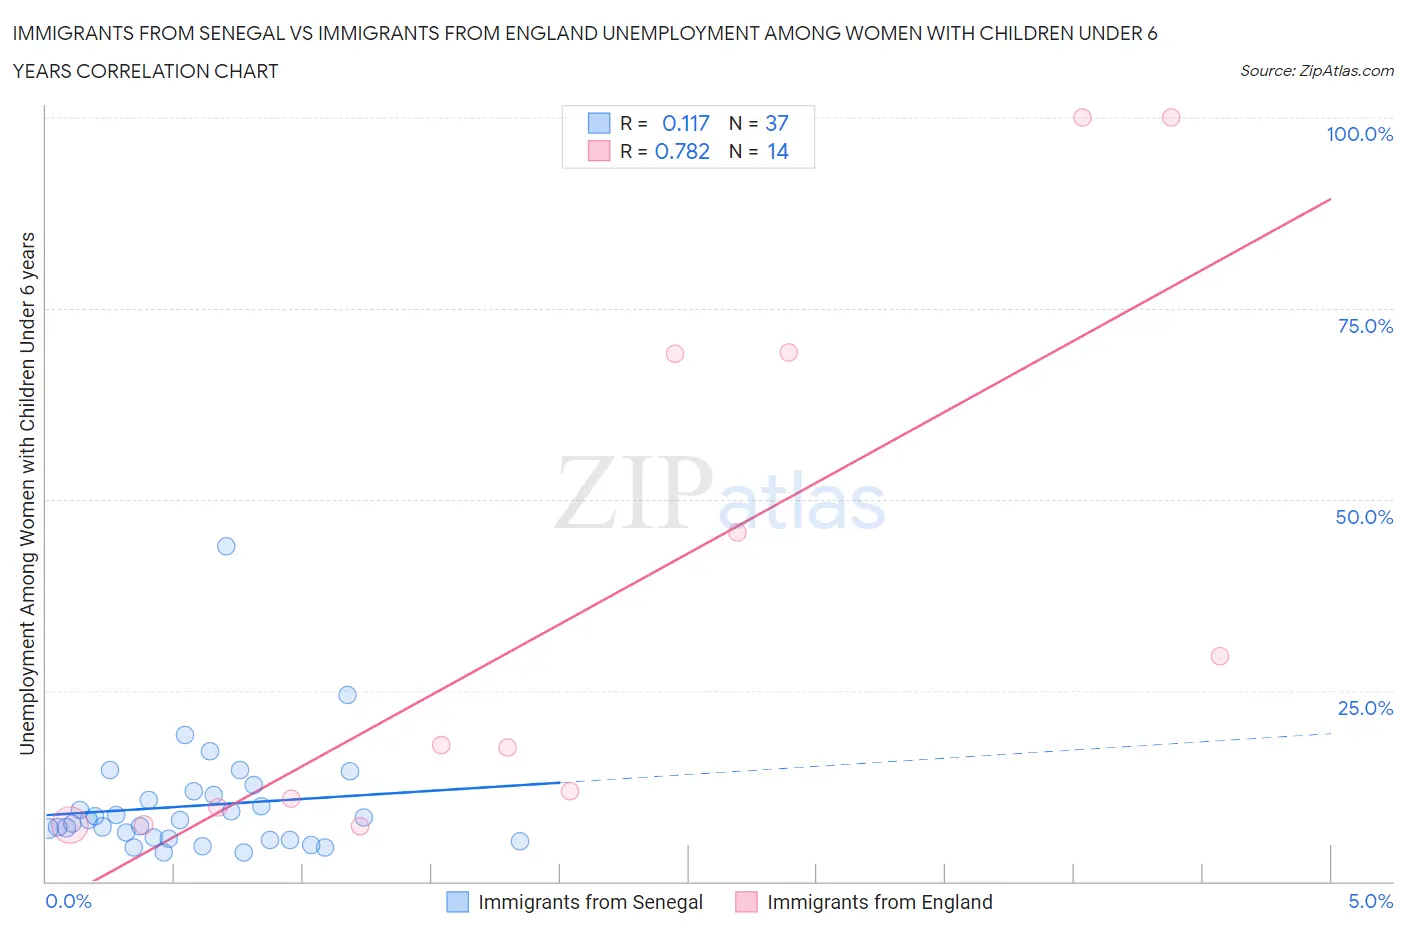
Immigrants from Senegal vs Immigrants from England Unemployment Among Women with Children Under 6 years Correlation Chart
The statistical analysis conducted on geographies consisting of 83,344,836 people shows a poor positive correlation between the proportion of Immigrants from Senegal and unemployment rate among women with children under the age of 6 in the United States with a correlation coefficient (R) of 0.117 and weighted average of 8.5%. Similarly, the statistical analysis conducted on geographies consisting of 294,765,132 people shows a strong positive correlation between the proportion of Immigrants from England and unemployment rate among women with children under the age of 6 in the United States with a correlation coefficient (R) of 0.782 and weighted average of 7.7%, a difference of 10.4%.
Unemployment Among Women with Children Under 6 years Correlation Summary
| Measurement | Immigrants from Senegal | Immigrants from England |
| Minimum | 3.7% | 7.2% |
| Maximum | 43.8% | 100.0% |
| Range | 40.1% | 92.8% |
| Mean | 9.9% | 35.9% |
| Median | 8.0% | 17.7% |
| Interquartile 25% (IQ1) | 5.5% | 9.7% |
| Interquartile 75% (IQ3) | 11.6% | 69.1% |
| Interquartile Range (IQR) | 6.1% | 59.4% |
| Standard Deviation (Sample) | 7.3% | 34.6% |
| Standard Deviation (Population) | 7.2% | 33.4% |
Similar Demographics by Unemployment Among Women with Children Under 6 years
Demographics Similar to Immigrants from Senegal by Unemployment Among Women with Children Under 6 years
In terms of unemployment among women with children under 6 years, the demographic groups most similar to Immigrants from Senegal are Immigrants from Congo (8.5%, a difference of 0.010%), Immigrants from Haiti (8.4%, a difference of 0.34%), Subsaharan African (8.4%, a difference of 0.43%), Belizean (8.4%, a difference of 0.53%), and Mexican American Indian (8.5%, a difference of 0.57%).
| Demographics | Rating | Rank | Unemployment Among Women with Children Under 6 years |
| Scotch-Irish | 0.3 /100 | #263 | Tragic 8.4% |
| Hondurans | 0.3 /100 | #264 | Tragic 8.4% |
| French Canadians | 0.3 /100 | #265 | Tragic 8.4% |
| Immigrants | Honduras | 0.3 /100 | #266 | Tragic 8.4% |
| Belizeans | 0.2 /100 | #267 | Tragic 8.4% |
| Sub-Saharan Africans | 0.2 /100 | #268 | Tragic 8.4% |
| Immigrants | Haiti | 0.2 /100 | #269 | Tragic 8.4% |
| Immigrants | Senegal | 0.2 /100 | #270 | Tragic 8.5% |
| Immigrants | Congo | 0.2 /100 | #271 | Tragic 8.5% |
| Mexican American Indians | 0.1 /100 | #272 | Tragic 8.5% |
| Slovaks | 0.1 /100 | #273 | Tragic 8.5% |
| Immigrants | Cameroon | 0.1 /100 | #274 | Tragic 8.6% |
| Immigrants | Latin America | 0.1 /100 | #275 | Tragic 8.6% |
| Yaqui | 0.0 /100 | #276 | Tragic 8.6% |
| Haitians | 0.0 /100 | #277 | Tragic 8.6% |
Demographics Similar to Immigrants from England by Unemployment Among Women with Children Under 6 years
In terms of unemployment among women with children under 6 years, the demographic groups most similar to Immigrants from England are Immigrants from Western Europe (7.7%, a difference of 0.030%), Austrian (7.7%, a difference of 0.040%), Immigrants from Uruguay (7.7%, a difference of 0.060%), Brazilian (7.7%, a difference of 0.10%), and Nepalese (7.7%, a difference of 0.12%).
| Demographics | Rating | Rank | Unemployment Among Women with Children Under 6 years |
| Immigrants | Grenada | 59.0 /100 | #171 | Average 7.6% |
| Immigrants | North America | 57.7 /100 | #172 | Average 7.6% |
| Cree | 51.6 /100 | #173 | Average 7.6% |
| Immigrants | Laos | 50.0 /100 | #174 | Average 7.6% |
| Panamanians | 49.6 /100 | #175 | Average 7.6% |
| Puget Sound Salish | 47.7 /100 | #176 | Average 7.7% |
| Austrians | 46.0 /100 | #177 | Average 7.7% |
| Immigrants | England | 45.4 /100 | #178 | Average 7.7% |
| Immigrants | Western Europe | 44.9 /100 | #179 | Average 7.7% |
| Immigrants | Uruguay | 44.5 /100 | #180 | Average 7.7% |
| Brazilians | 43.9 /100 | #181 | Average 7.7% |
| Nepalese | 43.5 /100 | #182 | Average 7.7% |
| Sierra Leoneans | 42.9 /100 | #183 | Average 7.7% |
| Indonesians | 40.5 /100 | #184 | Average 7.7% |
| Spanish Americans | 39.7 /100 | #185 | Fair 7.7% |