Carpatho Rusyn vs Immigrants from England Unemployment Among Women with Children Under 6 years
COMPARE
Carpatho Rusyn
Immigrants from England
Unemployment Among Women with Children Under 6 years
Unemployment Among Women with Children Under 6 years Comparison
Carpatho Rusyns
Immigrants from England
8.0%
UNEMPLOYMENT AMONG WOMEN WITH CHILDREN UNDER 6 YEARS
7.8/ 100
METRIC RATING
223rd/ 347
METRIC RANK
7.7%
UNEMPLOYMENT AMONG WOMEN WITH CHILDREN UNDER 6 YEARS
45.4/ 100
METRIC RATING
178th/ 347
METRIC RANK
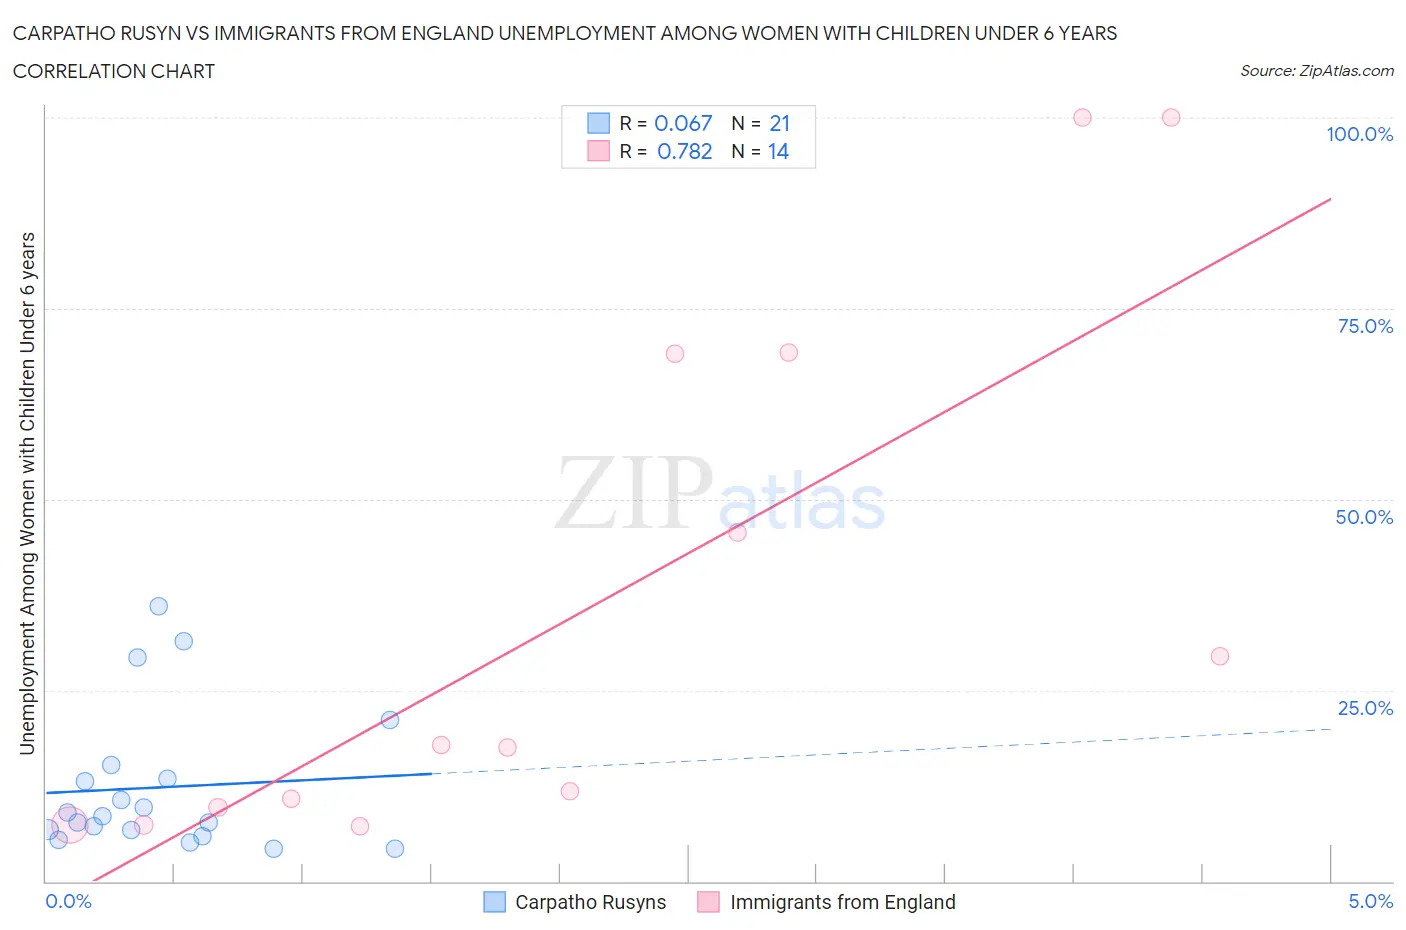
Carpatho Rusyn vs Immigrants from England Unemployment Among Women with Children Under 6 years Correlation Chart
The statistical analysis conducted on geographies consisting of 52,892,741 people shows a slight positive correlation between the proportion of Carpatho Rusyns and unemployment rate among women with children under the age of 6 in the United States with a correlation coefficient (R) of 0.067 and weighted average of 8.0%. Similarly, the statistical analysis conducted on geographies consisting of 294,765,132 people shows a strong positive correlation between the proportion of Immigrants from England and unemployment rate among women with children under the age of 6 in the United States with a correlation coefficient (R) of 0.782 and weighted average of 7.7%, a difference of 3.8%.
Unemployment Among Women with Children Under 6 years Correlation Summary
| Measurement | Carpatho Rusyn | Immigrants from England |
| Minimum | 4.2% | 7.2% |
| Maximum | 36.0% | 100.0% |
| Range | 31.8% | 92.8% |
| Mean | 12.3% | 35.9% |
| Median | 8.6% | 17.7% |
| Interquartile 25% (IQ1) | 6.3% | 9.7% |
| Interquartile 75% (IQ3) | 14.3% | 69.1% |
| Interquartile Range (IQR) | 8.1% | 59.4% |
| Standard Deviation (Sample) | 9.3% | 34.6% |
| Standard Deviation (Population) | 9.1% | 33.4% |
Similar Demographics by Unemployment Among Women with Children Under 6 years
Demographics Similar to Carpatho Rusyns by Unemployment Among Women with Children Under 6 years
In terms of unemployment among women with children under 6 years, the demographic groups most similar to Carpatho Rusyns are Samoan (7.9%, a difference of 0.13%), English (8.0%, a difference of 0.13%), Immigrants from Germany (7.9%, a difference of 0.15%), German (8.0%, a difference of 0.17%), and South American Indian (7.9%, a difference of 0.31%).
| Demographics | Rating | Rank | Unemployment Among Women with Children Under 6 years |
| Immigrants | Lebanon | 11.1 /100 | #216 | Poor 7.9% |
| Immigrants | Nigeria | 10.3 /100 | #217 | Poor 7.9% |
| Moroccans | 9.7 /100 | #218 | Tragic 7.9% |
| Arabs | 9.4 /100 | #219 | Tragic 7.9% |
| South American Indians | 9.3 /100 | #220 | Tragic 7.9% |
| Immigrants | Germany | 8.5 /100 | #221 | Tragic 7.9% |
| Samoans | 8.4 /100 | #222 | Tragic 7.9% |
| Carpatho Rusyns | 7.8 /100 | #223 | Tragic 8.0% |
| English | 7.2 /100 | #224 | Tragic 8.0% |
| Germans | 7.0 /100 | #225 | Tragic 8.0% |
| Senegalese | 6.2 /100 | #226 | Tragic 8.0% |
| Portuguese | 6.2 /100 | #227 | Tragic 8.0% |
| Immigrants | Sudan | 6.0 /100 | #228 | Tragic 8.0% |
| Salvadorans | 5.5 /100 | #229 | Tragic 8.0% |
| Finns | 5.3 /100 | #230 | Tragic 8.0% |
Demographics Similar to Immigrants from England by Unemployment Among Women with Children Under 6 years
In terms of unemployment among women with children under 6 years, the demographic groups most similar to Immigrants from England are Immigrants from Western Europe (7.7%, a difference of 0.030%), Austrian (7.7%, a difference of 0.040%), Immigrants from Uruguay (7.7%, a difference of 0.060%), Brazilian (7.7%, a difference of 0.10%), and Nepalese (7.7%, a difference of 0.12%).
| Demographics | Rating | Rank | Unemployment Among Women with Children Under 6 years |
| Immigrants | Grenada | 59.0 /100 | #171 | Average 7.6% |
| Immigrants | North America | 57.7 /100 | #172 | Average 7.6% |
| Cree | 51.6 /100 | #173 | Average 7.6% |
| Immigrants | Laos | 50.0 /100 | #174 | Average 7.6% |
| Panamanians | 49.6 /100 | #175 | Average 7.6% |
| Puget Sound Salish | 47.7 /100 | #176 | Average 7.7% |
| Austrians | 46.0 /100 | #177 | Average 7.7% |
| Immigrants | England | 45.4 /100 | #178 | Average 7.7% |
| Immigrants | Western Europe | 44.9 /100 | #179 | Average 7.7% |
| Immigrants | Uruguay | 44.5 /100 | #180 | Average 7.7% |
| Brazilians | 43.9 /100 | #181 | Average 7.7% |
| Nepalese | 43.5 /100 | #182 | Average 7.7% |
| Sierra Leoneans | 42.9 /100 | #183 | Average 7.7% |
| Indonesians | 40.5 /100 | #184 | Average 7.7% |
| Spanish Americans | 39.7 /100 | #185 | Fair 7.7% |