Immigrants from Scotland vs Immigrants from South America Unemployment Among Women with Children Ages 6 to 17 years
COMPARE
Immigrants from Scotland
Immigrants from South America
Unemployment Among Women with Children Ages 6 to 17 years
Unemployment Among Women with Children Ages 6 to 17 years Comparison
Immigrants from Scotland
Immigrants from South America
9.2%
UNEMPLOYMENT AMONG WOMEN WITH CHILDREN AGES 6 TO 17 YEARS
6.6/ 100
METRIC RATING
219th/ 347
METRIC RANK
9.4%
UNEMPLOYMENT AMONG WOMEN WITH CHILDREN AGES 6 TO 17 YEARS
1.5/ 100
METRIC RATING
249th/ 347
METRIC RANK
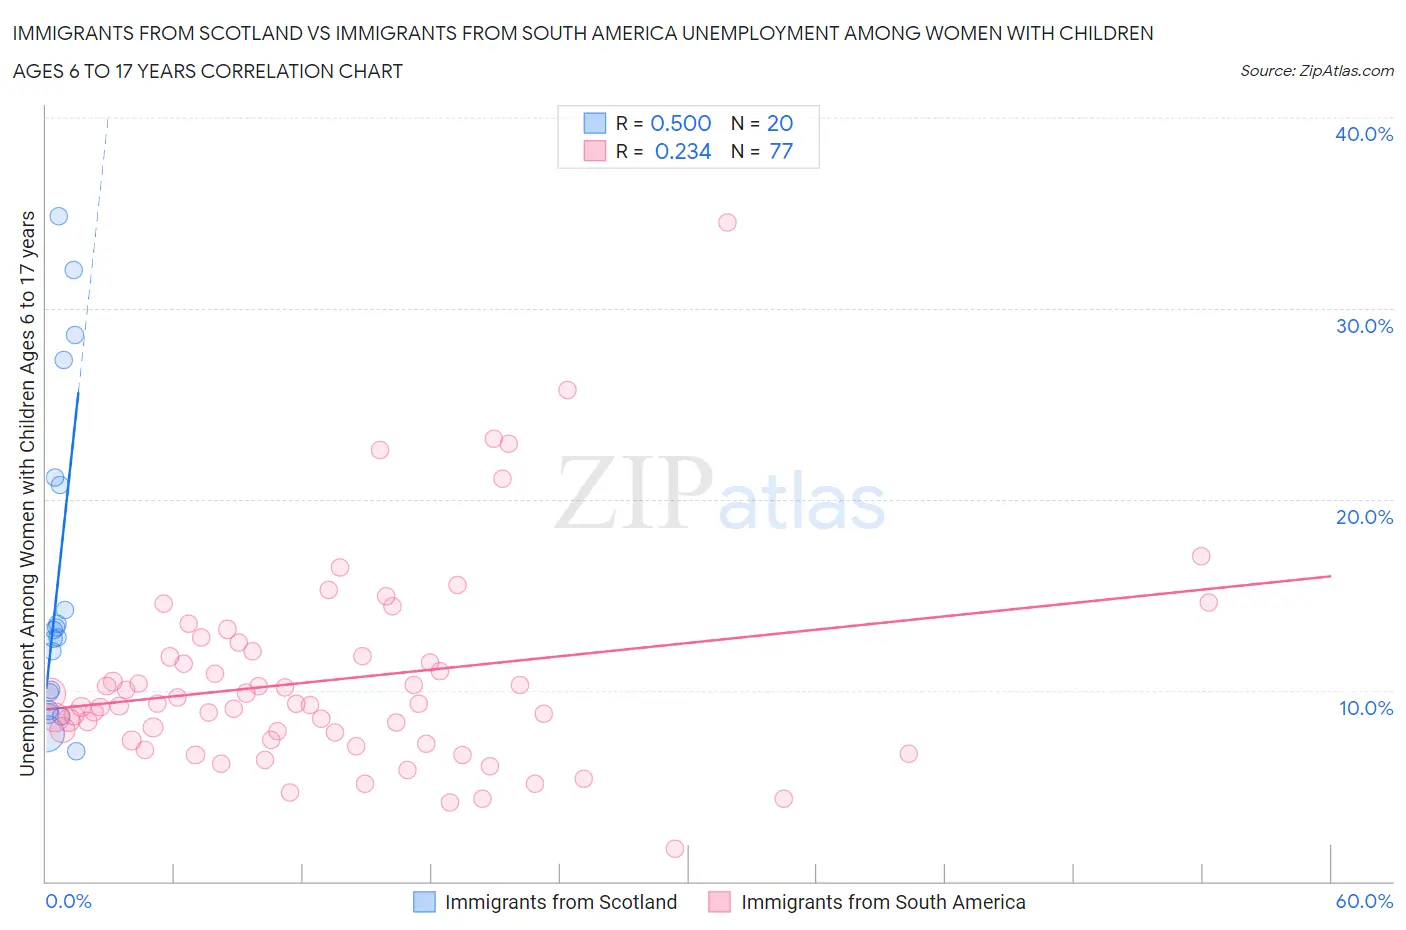
Immigrants from Scotland vs Immigrants from South America Unemployment Among Women with Children Ages 6 to 17 years Correlation Chart
The statistical analysis conducted on geographies consisting of 154,369,144 people shows a moderate positive correlation between the proportion of Immigrants from Scotland and unemployment rate among women with children between the ages 6 and 17 in the United States with a correlation coefficient (R) of 0.500 and weighted average of 9.2%. Similarly, the statistical analysis conducted on geographies consisting of 331,725,169 people shows a weak positive correlation between the proportion of Immigrants from South America and unemployment rate among women with children between the ages 6 and 17 in the United States with a correlation coefficient (R) of 0.234 and weighted average of 9.4%, a difference of 1.7%.
Unemployment Among Women with Children Ages 6 to 17 years Correlation Summary
| Measurement | Immigrants from Scotland | Immigrants from South America |
| Minimum | 6.8% | 1.7% |
| Maximum | 34.9% | 34.5% |
| Range | 28.1% | 32.8% |
| Mean | 15.9% | 10.6% |
| Median | 13.0% | 9.3% |
| Interquartile 25% (IQ1) | 9.4% | 7.4% |
| Interquartile 75% (IQ3) | 20.9% | 11.9% |
| Interquartile Range (IQR) | 11.5% | 4.5% |
| Standard Deviation (Sample) | 8.6% | 5.3% |
| Standard Deviation (Population) | 8.3% | 5.3% |
Similar Demographics by Unemployment Among Women with Children Ages 6 to 17 years
Demographics Similar to Immigrants from Scotland by Unemployment Among Women with Children Ages 6 to 17 years
In terms of unemployment among women with children ages 6 to 17 years, the demographic groups most similar to Immigrants from Scotland are Belgian (9.2%, a difference of 0.030%), Syrian (9.2%, a difference of 0.050%), German (9.2%, a difference of 0.10%), Immigrants from Germany (9.2%, a difference of 0.11%), and Immigrants from Uruguay (9.2%, a difference of 0.11%).
| Demographics | Rating | Rank | Unemployment Among Women with Children Ages 6 to 17 years |
| Peruvians | 9.0 /100 | #212 | Tragic 9.2% |
| Spaniards | 8.2 /100 | #213 | Tragic 9.2% |
| Iroquois | 7.5 /100 | #214 | Tragic 9.2% |
| Immigrants | Germany | 7.2 /100 | #215 | Tragic 9.2% |
| Immigrants | Uruguay | 7.2 /100 | #216 | Tragic 9.2% |
| Germans | 7.2 /100 | #217 | Tragic 9.2% |
| Syrians | 6.9 /100 | #218 | Tragic 9.2% |
| Immigrants | Scotland | 6.6 /100 | #219 | Tragic 9.2% |
| Belgians | 6.4 /100 | #220 | Tragic 9.2% |
| Crow | 5.8 /100 | #221 | Tragic 9.2% |
| Immigrants | Southern Europe | 5.8 /100 | #222 | Tragic 9.2% |
| Immigrants | Eritrea | 5.8 /100 | #223 | Tragic 9.2% |
| Immigrants | El Salvador | 5.3 /100 | #224 | Tragic 9.3% |
| Chinese | 5.2 /100 | #225 | Tragic 9.3% |
| Immigrants | Azores | 4.6 /100 | #226 | Tragic 9.3% |
Demographics Similar to Immigrants from South America by Unemployment Among Women with Children Ages 6 to 17 years
In terms of unemployment among women with children ages 6 to 17 years, the demographic groups most similar to Immigrants from South America are Dutch (9.4%, a difference of 0.010%), Polish (9.4%, a difference of 0.050%), Immigrants from Africa (9.4%, a difference of 0.080%), Immigrants from Guatemala (9.4%, a difference of 0.090%), and Central American (9.4%, a difference of 0.10%).
| Demographics | Rating | Rank | Unemployment Among Women with Children Ages 6 to 17 years |
| Immigrants | Colombia | 2.1 /100 | #242 | Tragic 9.3% |
| Scottish | 2.0 /100 | #243 | Tragic 9.4% |
| English | 1.9 /100 | #244 | Tragic 9.4% |
| Immigrants | Cameroon | 1.8 /100 | #245 | Tragic 9.4% |
| Immigrants | Africa | 1.6 /100 | #246 | Tragic 9.4% |
| Poles | 1.5 /100 | #247 | Tragic 9.4% |
| Dutch | 1.5 /100 | #248 | Tragic 9.4% |
| Immigrants | South America | 1.5 /100 | #249 | Tragic 9.4% |
| Immigrants | Guatemala | 1.3 /100 | #250 | Tragic 9.4% |
| Central Americans | 1.3 /100 | #251 | Tragic 9.4% |
| Creek | 1.2 /100 | #252 | Tragic 9.4% |
| Portuguese | 1.1 /100 | #253 | Tragic 9.4% |
| Nicaraguans | 1.0 /100 | #254 | Tragic 9.4% |
| Lithuanians | 0.9 /100 | #255 | Tragic 9.4% |
| Canadians | 0.8 /100 | #256 | Tragic 9.4% |