Immigrants from Saudi Arabia vs Immigrants from South Eastern Asia Unemployment Among Women with Children Under 18 years
COMPARE
Immigrants from Saudi Arabia
Immigrants from South Eastern Asia
Unemployment Among Women with Children Under 18 years
Unemployment Among Women with Children Under 18 years Comparison
Immigrants from Saudi Arabia
Immigrants from South Eastern Asia
5.4%
UNEMPLOYMENT AMONG WOMEN WITH CHILDREN UNDER 18 YEARS
65.0/ 100
METRIC RATING
162nd/ 347
METRIC RANK
5.4%
UNEMPLOYMENT AMONG WOMEN WITH CHILDREN UNDER 18 YEARS
71.1/ 100
METRIC RATING
152nd/ 347
METRIC RANK
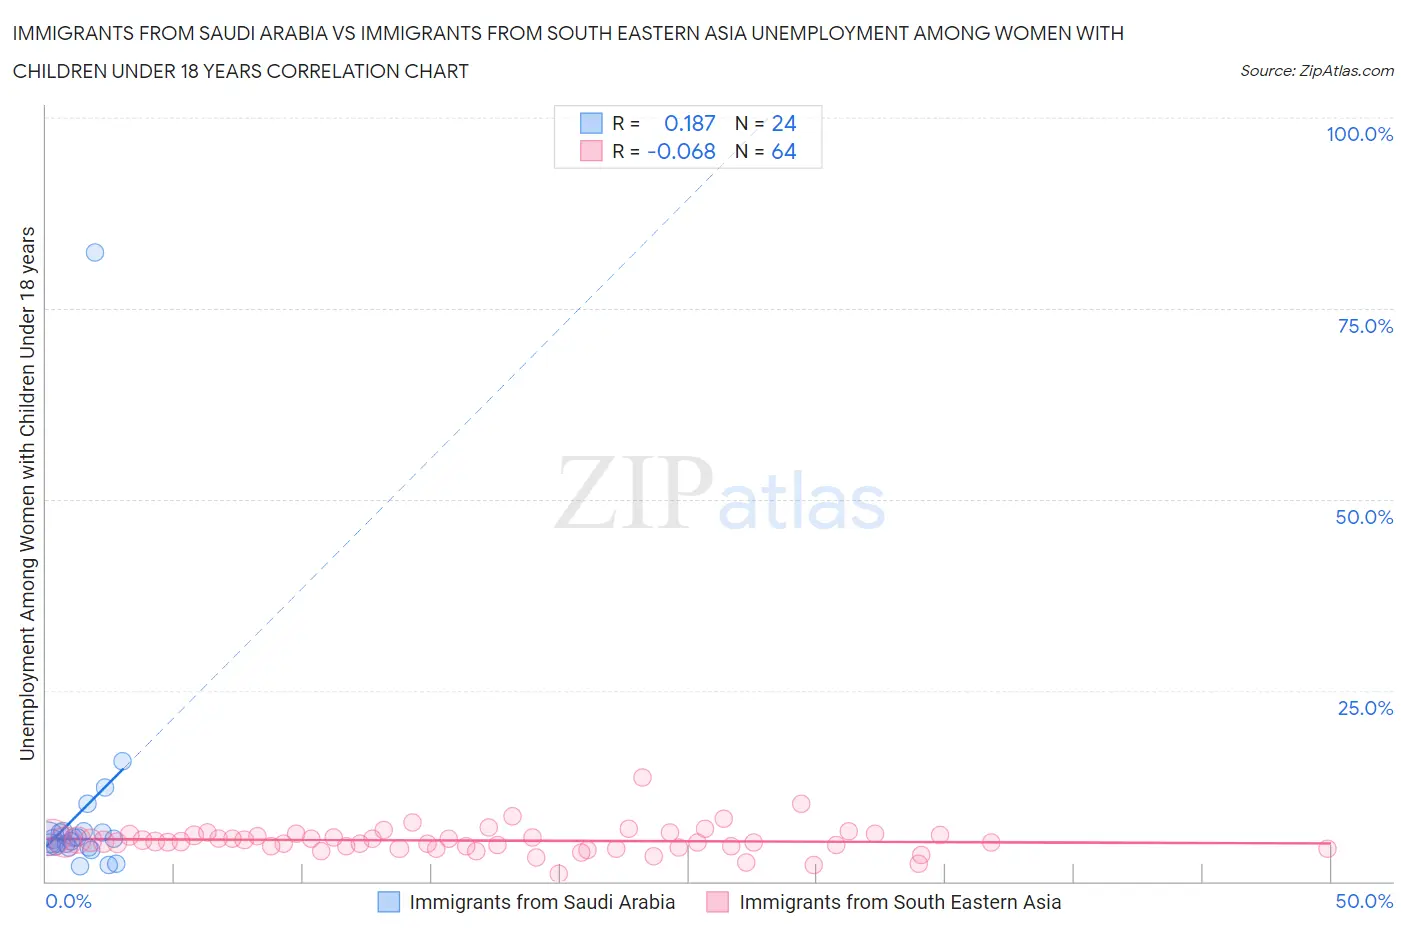
Immigrants from Saudi Arabia vs Immigrants from South Eastern Asia Unemployment Among Women with Children Under 18 years Correlation Chart
The statistical analysis conducted on geographies consisting of 162,263,235 people shows a poor positive correlation between the proportion of Immigrants from Saudi Arabia and unemployment rate among women with children under the age of 18 in the United States with a correlation coefficient (R) of 0.187 and weighted average of 5.4%. Similarly, the statistical analysis conducted on geographies consisting of 480,470,573 people shows a slight negative correlation between the proportion of Immigrants from South Eastern Asia and unemployment rate among women with children under the age of 18 in the United States with a correlation coefficient (R) of -0.068 and weighted average of 5.4%, a difference of 0.50%.
Unemployment Among Women with Children Under 18 years Correlation Summary
| Measurement | Immigrants from Saudi Arabia | Immigrants from South Eastern Asia |
| Minimum | 1.9% | 1.0% |
| Maximum | 82.4% | 13.6% |
| Range | 80.5% | 12.6% |
| Mean | 9.1% | 5.3% |
| Median | 5.5% | 5.2% |
| Interquartile 25% (IQ1) | 4.5% | 4.5% |
| Interquartile 75% (IQ3) | 6.5% | 6.0% |
| Interquartile Range (IQR) | 1.9% | 1.5% |
| Standard Deviation (Sample) | 15.9% | 1.8% |
| Standard Deviation (Population) | 15.6% | 1.8% |
Demographics Similar to Immigrants from Saudi Arabia and Immigrants from South Eastern Asia by Unemployment Among Women with Children Under 18 years
In terms of unemployment among women with children under 18 years, the demographic groups most similar to Immigrants from Saudi Arabia are Lebanese (5.4%, a difference of 0.030%), Immigrants from Iraq (5.4%, a difference of 0.070%), Afghan (5.4%, a difference of 0.12%), Celtic (5.4%, a difference of 0.16%), and Tlingit-Haida (5.4%, a difference of 0.24%). Similarly, the demographic groups most similar to Immigrants from South Eastern Asia are Immigrants from Iran (5.4%, a difference of 0.010%), Carpatho Rusyn (5.4%, a difference of 0.020%), Immigrants from Latvia (5.4%, a difference of 0.030%), Korean (5.4%, a difference of 0.050%), and Immigrants from Argentina (5.4%, a difference of 0.060%).
| Demographics | Rating | Rank | Unemployment Among Women with Children Under 18 years |
| Bangladeshis | 73.2 /100 | #147 | Good 5.3% |
| Immigrants | Western Europe | 72.8 /100 | #148 | Good 5.4% |
| Immigrants | Kenya | 72.2 /100 | #149 | Good 5.4% |
| Immigrants | Argentina | 71.7 /100 | #150 | Good 5.4% |
| Immigrants | Iran | 71.1 /100 | #151 | Good 5.4% |
| Immigrants | South Eastern Asia | 71.1 /100 | #152 | Good 5.4% |
| Carpatho Rusyns | 70.8 /100 | #153 | Good 5.4% |
| Immigrants | Latvia | 70.8 /100 | #154 | Good 5.4% |
| Koreans | 70.5 /100 | #155 | Good 5.4% |
| South Africans | 70.3 /100 | #156 | Good 5.4% |
| German Russians | 70.2 /100 | #157 | Good 5.4% |
| Immigrants | Burma/Myanmar | 69.5 /100 | #158 | Good 5.4% |
| Chickasaw | 68.4 /100 | #159 | Good 5.4% |
| Afghans | 66.6 /100 | #160 | Good 5.4% |
| Immigrants | Iraq | 65.9 /100 | #161 | Good 5.4% |
| Immigrants | Saudi Arabia | 65.0 /100 | #162 | Good 5.4% |
| Lebanese | 64.7 /100 | #163 | Good 5.4% |
| Celtics | 63.0 /100 | #164 | Good 5.4% |
| Tlingit-Haida | 61.9 /100 | #165 | Good 5.4% |
| Aleuts | 59.4 /100 | #166 | Average 5.4% |
| Immigrants | Denmark | 58.0 /100 | #167 | Average 5.4% |