Immigrants from Saudi Arabia vs Immigrants from Scotland Unemployment Among Youth under 25 years
COMPARE
Immigrants from Saudi Arabia
Immigrants from Scotland
Unemployment Among Youth under 25 years
Unemployment Among Youth under 25 years Comparison
Immigrants from Saudi Arabia
Immigrants from Scotland
11.1%
UNEMPLOYMENT AMONG YOUTH UNDER 25 YEARS
98.8/ 100
METRIC RATING
56th/ 347
METRIC RANK
11.4%
UNEMPLOYMENT AMONG YOUTH UNDER 25 YEARS
89.2/ 100
METRIC RATING
119th/ 347
METRIC RANK
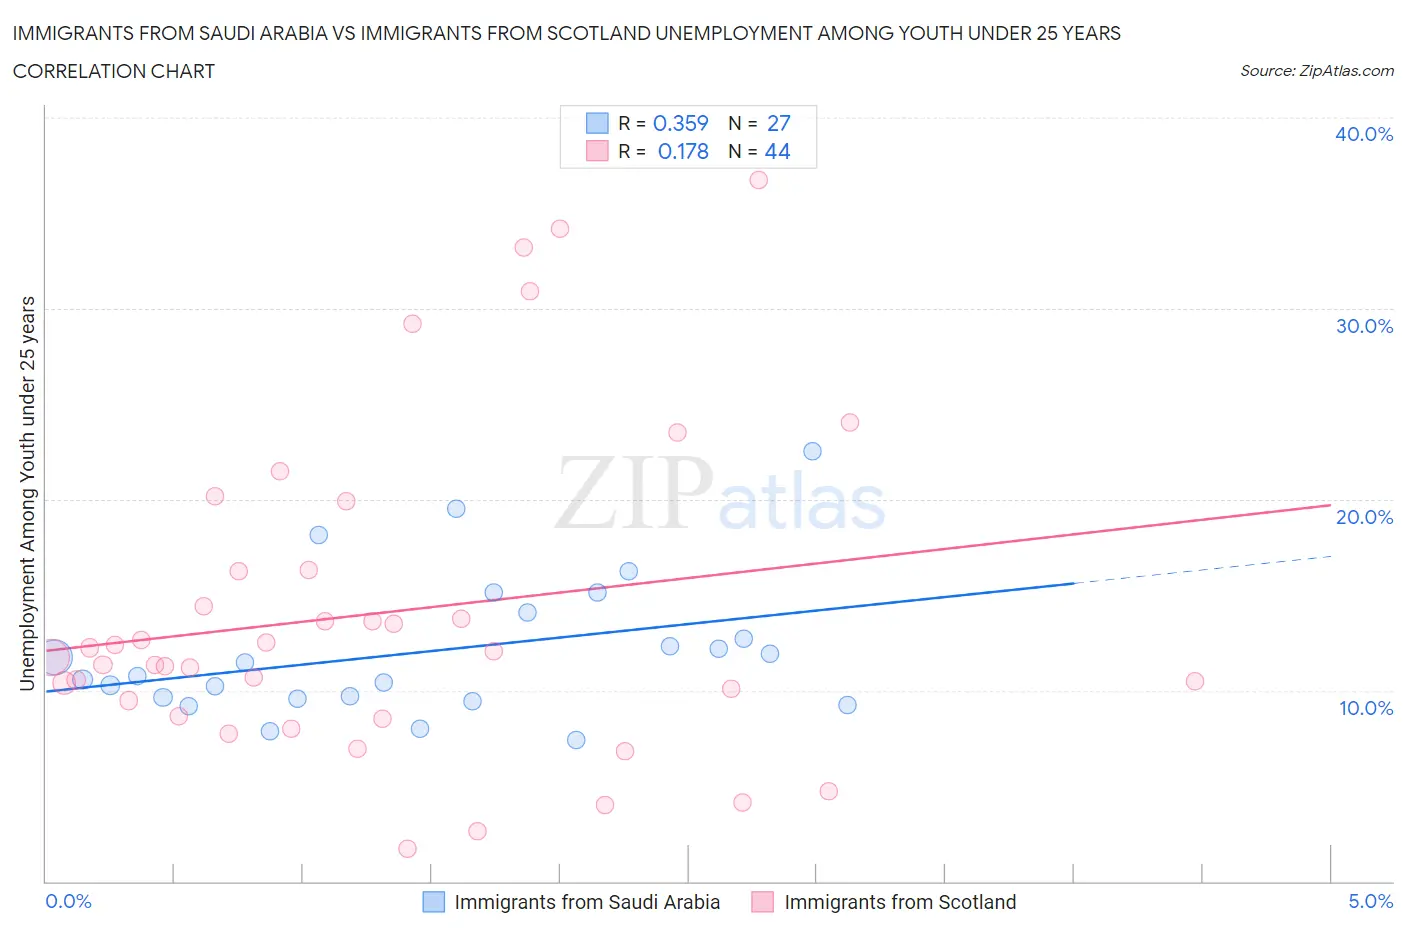
Immigrants from Saudi Arabia vs Immigrants from Scotland Unemployment Among Youth under 25 years Correlation Chart
The statistical analysis conducted on geographies consisting of 163,954,627 people shows a mild positive correlation between the proportion of Immigrants from Saudi Arabia and unemployment rate among youth under the age of 25 in the United States with a correlation coefficient (R) of 0.359 and weighted average of 11.1%. Similarly, the statistical analysis conducted on geographies consisting of 195,015,397 people shows a poor positive correlation between the proportion of Immigrants from Scotland and unemployment rate among youth under the age of 25 in the United States with a correlation coefficient (R) of 0.178 and weighted average of 11.4%, a difference of 2.5%.
Unemployment Among Youth under 25 years Correlation Summary
| Measurement | Immigrants from Saudi Arabia | Immigrants from Scotland |
| Minimum | 7.4% | 1.7% |
| Maximum | 22.5% | 36.7% |
| Range | 15.1% | 35.0% |
| Mean | 12.0% | 14.1% |
| Median | 10.7% | 11.9% |
| Interquartile 25% (IQ1) | 9.6% | 9.1% |
| Interquartile 75% (IQ3) | 14.0% | 16.3% |
| Interquartile Range (IQR) | 4.5% | 7.2% |
| Standard Deviation (Sample) | 3.7% | 8.5% |
| Standard Deviation (Population) | 3.6% | 8.4% |
Similar Demographics by Unemployment Among Youth under 25 years
Demographics Similar to Immigrants from Saudi Arabia by Unemployment Among Youth under 25 years
In terms of unemployment among youth under 25 years, the demographic groups most similar to Immigrants from Saudi Arabia are Immigrants from Eritrea (11.1%, a difference of 0.010%), Mongolian (11.1%, a difference of 0.020%), Irish (11.1%, a difference of 0.020%), Scotch-Irish (11.1%, a difference of 0.050%), and Ottawa (11.1%, a difference of 0.11%).
| Demographics | Rating | Rank | Unemployment Among Youth under 25 years |
| Thais | 99.3 /100 | #49 | Exceptional 11.0% |
| Czechoslovakians | 99.2 /100 | #50 | Exceptional 11.0% |
| Serbians | 99.0 /100 | #51 | Exceptional 11.0% |
| Latvians | 99.0 /100 | #52 | Exceptional 11.0% |
| Ottawa | 99.0 /100 | #53 | Exceptional 11.1% |
| Mongolians | 98.9 /100 | #54 | Exceptional 11.1% |
| Irish | 98.9 /100 | #55 | Exceptional 11.1% |
| Immigrants | Saudi Arabia | 98.8 /100 | #56 | Exceptional 11.1% |
| Immigrants | Eritrea | 98.8 /100 | #57 | Exceptional 11.1% |
| Scotch-Irish | 98.8 /100 | #58 | Exceptional 11.1% |
| Immigrants | Eastern Africa | 98.7 /100 | #59 | Exceptional 11.1% |
| South Africans | 98.5 /100 | #60 | Exceptional 11.1% |
| Filipinos | 98.3 /100 | #61 | Exceptional 11.1% |
| Immigrants | Netherlands | 98.1 /100 | #62 | Exceptional 11.1% |
| Immigrants | Croatia | 98.1 /100 | #63 | Exceptional 11.1% |
Demographics Similar to Immigrants from Scotland by Unemployment Among Youth under 25 years
In terms of unemployment among youth under 25 years, the demographic groups most similar to Immigrants from Scotland are Malaysian (11.4%, a difference of 0.020%), Slovak (11.4%, a difference of 0.040%), Afghan (11.3%, a difference of 0.050%), Sri Lankan (11.3%, a difference of 0.060%), and Immigrants from Vietnam (11.3%, a difference of 0.070%).
| Demographics | Rating | Rank | Unemployment Among Youth under 25 years |
| Immigrants | Austria | 90.3 /100 | #112 | Exceptional 11.3% |
| Fijians | 90.2 /100 | #113 | Exceptional 11.3% |
| Immigrants | Ethiopia | 89.9 /100 | #114 | Excellent 11.3% |
| Immigrants | Vietnam | 89.9 /100 | #115 | Excellent 11.3% |
| Burmese | 89.8 /100 | #116 | Excellent 11.3% |
| Sri Lankans | 89.8 /100 | #117 | Excellent 11.3% |
| Afghans | 89.7 /100 | #118 | Excellent 11.3% |
| Immigrants | Scotland | 89.2 /100 | #119 | Excellent 11.4% |
| Malaysians | 89.0 /100 | #120 | Excellent 11.4% |
| Slovaks | 88.9 /100 | #121 | Excellent 11.4% |
| Immigrants | Micronesia | 88.1 /100 | #122 | Excellent 11.4% |
| Basques | 87.8 /100 | #123 | Excellent 11.4% |
| Italians | 87.2 /100 | #124 | Excellent 11.4% |
| Immigrants | Argentina | 87.2 /100 | #125 | Excellent 11.4% |
| Canadians | 86.6 /100 | #126 | Excellent 11.4% |