Immigrants from Indonesia vs Immigrants from Scotland Unemployment Among Youth under 25 years
COMPARE
Immigrants from Indonesia
Immigrants from Scotland
Unemployment Among Youth under 25 years
Unemployment Among Youth under 25 years Comparison
Immigrants from Indonesia
Immigrants from Scotland
11.5%
UNEMPLOYMENT AMONG YOUTH UNDER 25 YEARS
77.6/ 100
METRIC RATING
139th/ 347
METRIC RANK
11.4%
UNEMPLOYMENT AMONG YOUTH UNDER 25 YEARS
89.2/ 100
METRIC RATING
119th/ 347
METRIC RANK
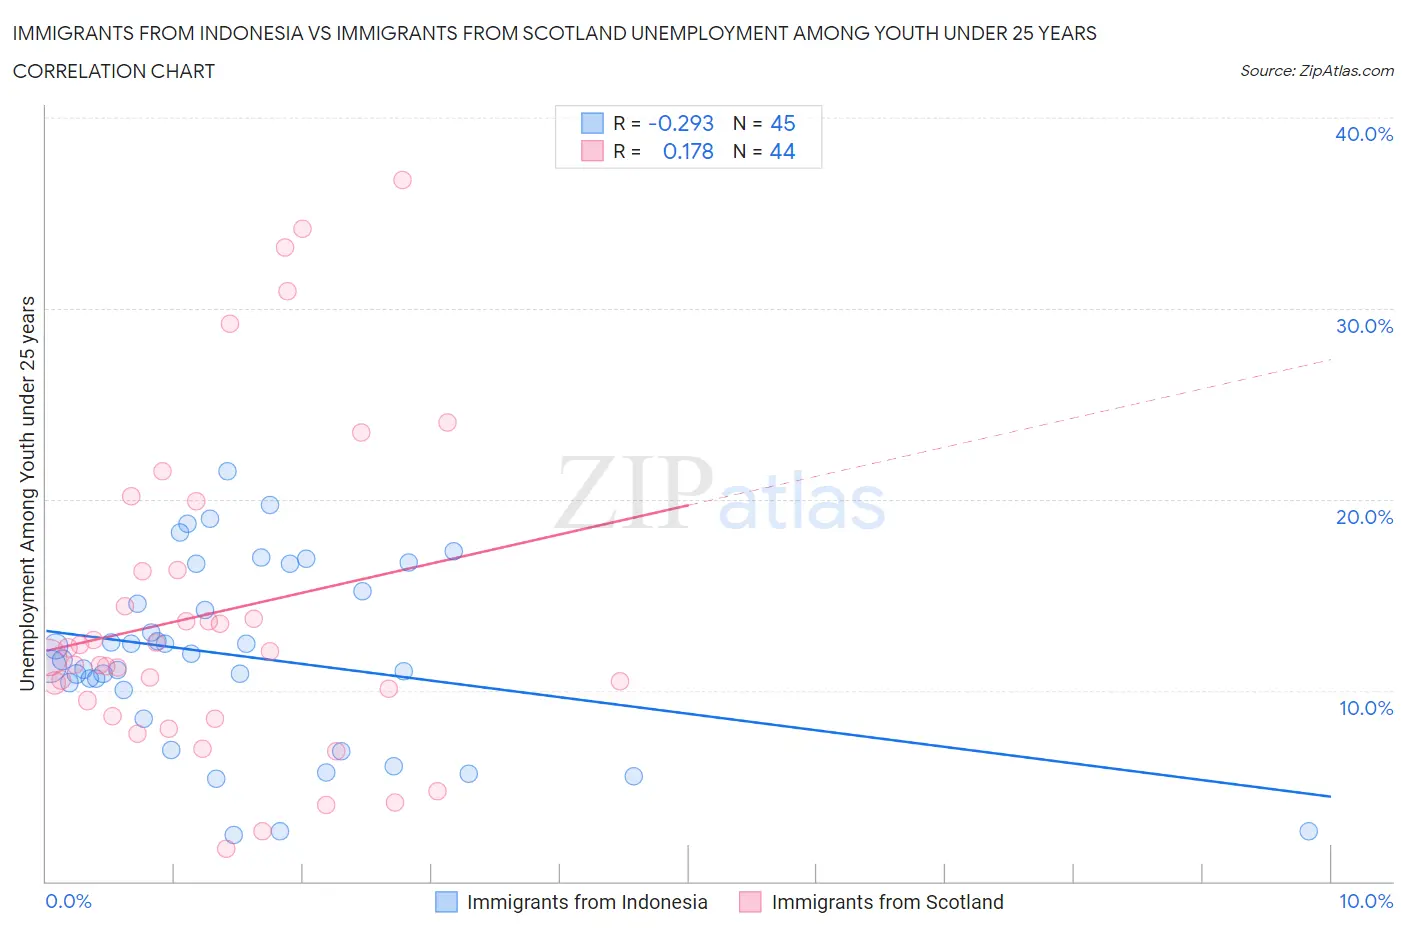
Immigrants from Indonesia vs Immigrants from Scotland Unemployment Among Youth under 25 years Correlation Chart
The statistical analysis conducted on geographies consisting of 214,867,001 people shows a weak negative correlation between the proportion of Immigrants from Indonesia and unemployment rate among youth under the age of 25 in the United States with a correlation coefficient (R) of -0.293 and weighted average of 11.5%. Similarly, the statistical analysis conducted on geographies consisting of 195,015,397 people shows a poor positive correlation between the proportion of Immigrants from Scotland and unemployment rate among youth under the age of 25 in the United States with a correlation coefficient (R) of 0.178 and weighted average of 11.4%, a difference of 0.91%.
Unemployment Among Youth under 25 years Correlation Summary
| Measurement | Immigrants from Indonesia | Immigrants from Scotland |
| Minimum | 2.4% | 1.7% |
| Maximum | 21.5% | 36.7% |
| Range | 19.1% | 35.0% |
| Mean | 11.8% | 14.1% |
| Median | 11.6% | 11.9% |
| Interquartile 25% (IQ1) | 9.3% | 9.1% |
| Interquartile 75% (IQ3) | 15.9% | 16.3% |
| Interquartile Range (IQR) | 6.6% | 7.2% |
| Standard Deviation (Sample) | 4.8% | 8.5% |
| Standard Deviation (Population) | 4.7% | 8.4% |
Demographics Similar to Immigrants from Indonesia and Immigrants from Scotland by Unemployment Among Youth under 25 years
In terms of unemployment among youth under 25 years, the demographic groups most similar to Immigrants from Indonesia are Immigrants from England (11.5%, a difference of 0.030%), Asian (11.4%, a difference of 0.13%), Romanian (11.4%, a difference of 0.15%), Immigrants from Oceania (11.4%, a difference of 0.16%), and Immigrants from Chile (11.4%, a difference of 0.17%). Similarly, the demographic groups most similar to Immigrants from Scotland are Malaysian (11.4%, a difference of 0.020%), Slovak (11.4%, a difference of 0.040%), Immigrants from Micronesia (11.4%, a difference of 0.12%), Basque (11.4%, a difference of 0.14%), and Italian (11.4%, a difference of 0.21%).
| Demographics | Rating | Rank | Unemployment Among Youth under 25 years |
| Immigrants | Scotland | 89.2 /100 | #119 | Excellent 11.4% |
| Malaysians | 89.0 /100 | #120 | Excellent 11.4% |
| Slovaks | 88.9 /100 | #121 | Excellent 11.4% |
| Immigrants | Micronesia | 88.1 /100 | #122 | Excellent 11.4% |
| Basques | 87.8 /100 | #123 | Excellent 11.4% |
| Italians | 87.2 /100 | #124 | Excellent 11.4% |
| Immigrants | Argentina | 87.2 /100 | #125 | Excellent 11.4% |
| Canadians | 86.6 /100 | #126 | Excellent 11.4% |
| Greeks | 86.2 /100 | #127 | Excellent 11.4% |
| Immigrants | Hungary | 86.0 /100 | #128 | Excellent 11.4% |
| Turks | 85.8 /100 | #129 | Excellent 11.4% |
| Hungarians | 85.7 /100 | #130 | Excellent 11.4% |
| Immigrants | Spain | 84.6 /100 | #131 | Excellent 11.4% |
| Ethiopians | 83.2 /100 | #132 | Excellent 11.4% |
| Lebanese | 83.1 /100 | #133 | Excellent 11.4% |
| Immigrants | Chile | 80.4 /100 | #134 | Excellent 11.4% |
| Immigrants | Oceania | 80.2 /100 | #135 | Excellent 11.4% |
| Romanians | 80.1 /100 | #136 | Excellent 11.4% |
| Asians | 79.7 /100 | #137 | Good 11.4% |
| Immigrants | England | 78.1 /100 | #138 | Good 11.5% |
| Immigrants | Indonesia | 77.6 /100 | #139 | Good 11.5% |