Immigrants from Philippines vs Iraqi Unemployment Among Women with Children Under 18 years
COMPARE
Immigrants from Philippines
Iraqi
Unemployment Among Women with Children Under 18 years
Unemployment Among Women with Children Under 18 years Comparison
Immigrants from Philippines
Iraqis
5.4%
UNEMPLOYMENT AMONG WOMEN WITH CHILDREN UNDER 18 YEARS
53.1/ 100
METRIC RATING
171st/ 347
METRIC RANK
5.5%
UNEMPLOYMENT AMONG WOMEN WITH CHILDREN UNDER 18 YEARS
35.3/ 100
METRIC RATING
188th/ 347
METRIC RANK
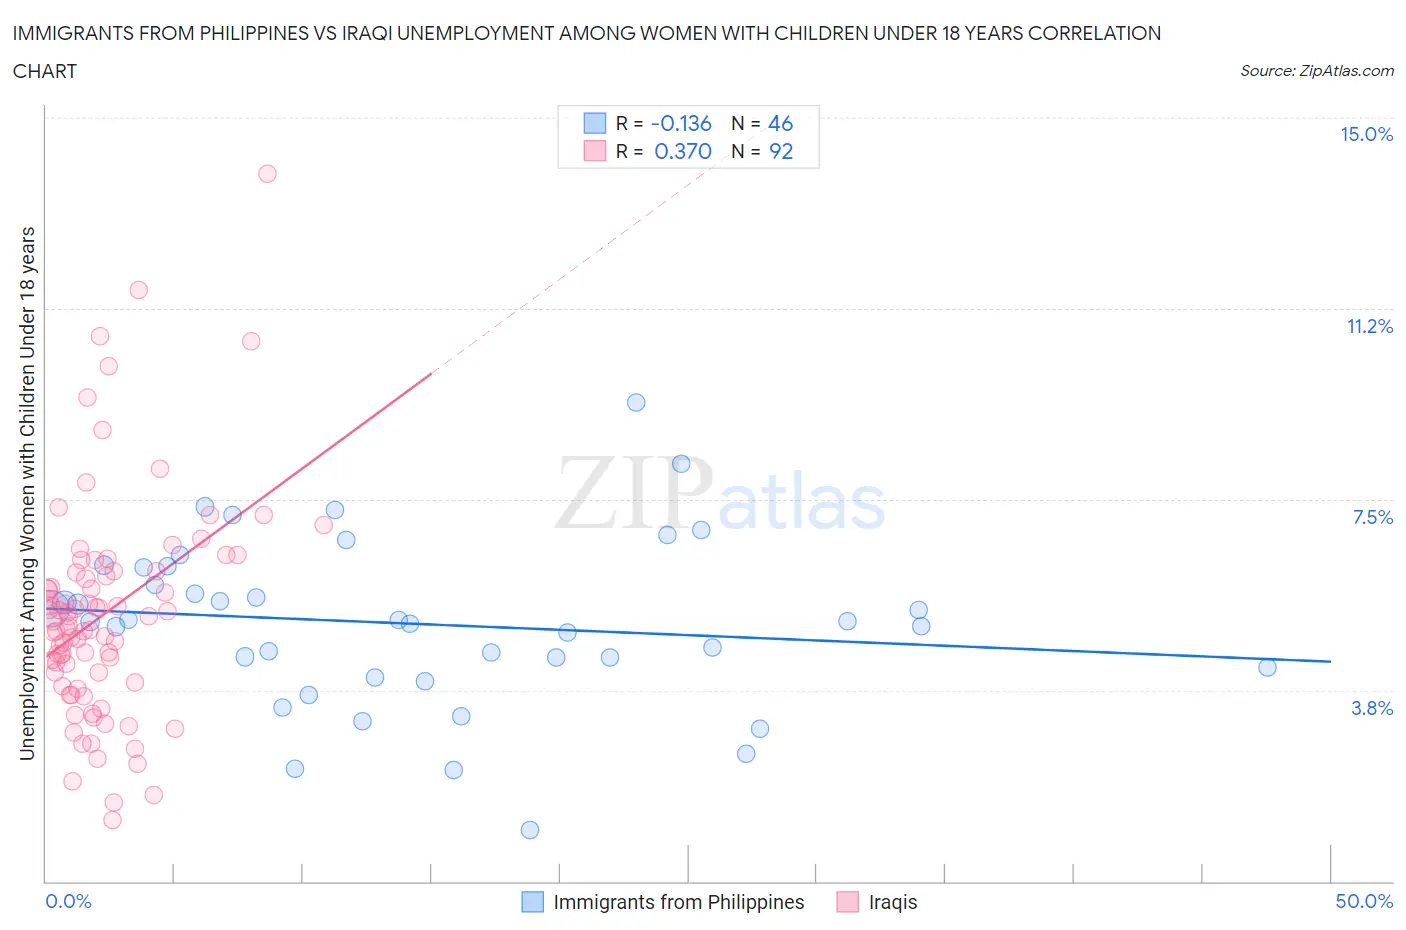
Immigrants from Philippines vs Iraqi Unemployment Among Women with Children Under 18 years Correlation Chart
The statistical analysis conducted on geographies consisting of 447,841,859 people shows a poor negative correlation between the proportion of Immigrants from Philippines and unemployment rate among women with children under the age of 18 in the United States with a correlation coefficient (R) of -0.136 and weighted average of 5.4%. Similarly, the statistical analysis conducted on geographies consisting of 168,205,992 people shows a mild positive correlation between the proportion of Iraqis and unemployment rate among women with children under the age of 18 in the United States with a correlation coefficient (R) of 0.370 and weighted average of 5.5%, a difference of 1.3%.
Unemployment Among Women with Children Under 18 years Correlation Summary
| Measurement | Immigrants from Philippines | Iraqi |
| Minimum | 1.0% | 1.2% |
| Maximum | 9.4% | 13.9% |
| Range | 8.4% | 12.7% |
| Mean | 5.1% | 5.3% |
| Median | 5.1% | 5.1% |
| Interquartile 25% (IQ1) | 4.2% | 4.0% |
| Interquartile 75% (IQ3) | 6.2% | 6.1% |
| Interquartile Range (IQR) | 2.0% | 2.1% |
| Standard Deviation (Sample) | 1.6% | 2.2% |
| Standard Deviation (Population) | 1.6% | 2.1% |
Demographics Similar to Immigrants from Philippines and Iraqis by Unemployment Among Women with Children Under 18 years
In terms of unemployment among women with children under 18 years, the demographic groups most similar to Immigrants from Philippines are Samoan (5.4%, a difference of 0.070%), Immigrants from Kazakhstan (5.4%, a difference of 0.10%), Immigrants from Eastern Africa (5.4%, a difference of 0.13%), Immigrants from Thailand (5.4%, a difference of 0.16%), and Immigrants from Uzbekistan (5.4%, a difference of 0.22%). Similarly, the demographic groups most similar to Iraqis are Malaysian (5.5%, a difference of 0.030%), Indonesian (5.5%, a difference of 0.080%), Immigrants from Eritrea (5.5%, a difference of 0.12%), Immigrants from Zaire (5.5%, a difference of 0.21%), and Immigrants from Cambodia (5.5%, a difference of 0.23%).
| Demographics | Rating | Rank | Unemployment Among Women with Children Under 18 years |
| Immigrants | Thailand | 55.3 /100 | #169 | Average 5.4% |
| Samoans | 54.1 /100 | #170 | Average 5.4% |
| Immigrants | Philippines | 53.1 /100 | #171 | Average 5.4% |
| Immigrants | Kazakhstan | 51.7 /100 | #172 | Average 5.4% |
| Immigrants | Eastern Africa | 51.3 /100 | #173 | Average 5.4% |
| Immigrants | Uzbekistan | 50.0 /100 | #174 | Average 5.4% |
| Spanish | 49.0 /100 | #175 | Average 5.4% |
| Immigrants | Germany | 48.5 /100 | #176 | Average 5.5% |
| Hawaiians | 46.1 /100 | #177 | Average 5.5% |
| Costa Ricans | 45.2 /100 | #178 | Average 5.5% |
| Syrians | 42.8 /100 | #179 | Average 5.5% |
| Immigrants | Southern Europe | 42.7 /100 | #180 | Average 5.5% |
| Immigrants | Hungary | 41.3 /100 | #181 | Average 5.5% |
| Immigrants | Sudan | 40.6 /100 | #182 | Average 5.5% |
| Immigrants | Laos | 38.8 /100 | #183 | Fair 5.5% |
| Immigrants | Cambodia | 38.4 /100 | #184 | Fair 5.5% |
| Immigrants | Zaire | 38.1 /100 | #185 | Fair 5.5% |
| Indonesians | 36.3 /100 | #186 | Fair 5.5% |
| Malaysians | 35.7 /100 | #187 | Fair 5.5% |
| Iraqis | 35.3 /100 | #188 | Fair 5.5% |
| Immigrants | Eritrea | 33.8 /100 | #189 | Fair 5.5% |