Immigrants from Philippines vs Iraqi 3rd Grade
COMPARE
Immigrants from Philippines
Iraqi
3rd Grade
3rd Grade Comparison
Immigrants from Philippines
Iraqis
97.2%
3RD GRADE
0.1/ 100
METRIC RATING
279th/ 347
METRIC RANK
97.5%
3RD GRADE
6.9/ 100
METRIC RATING
215th/ 347
METRIC RANK
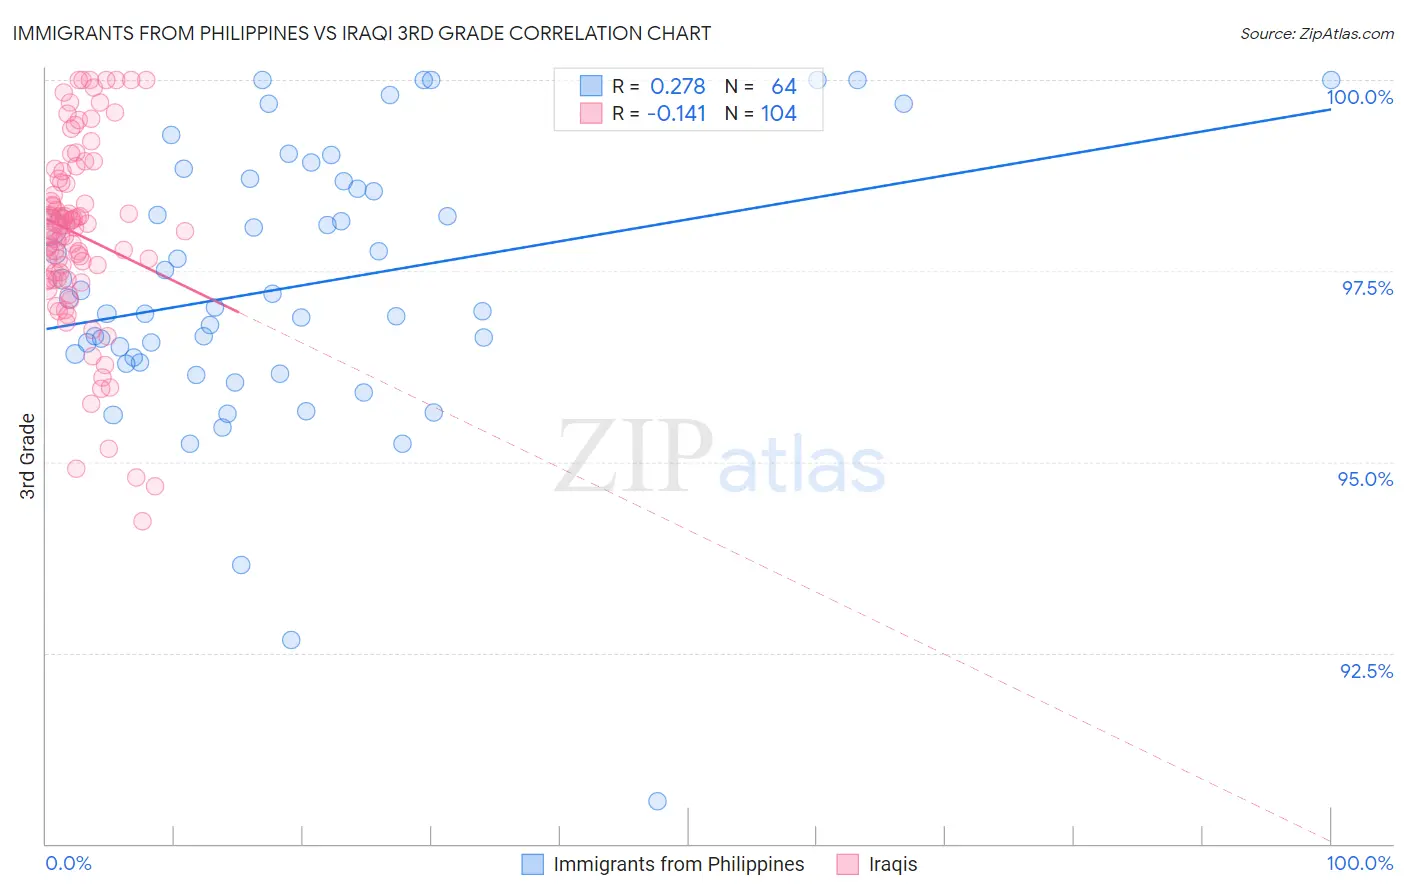
Immigrants from Philippines vs Iraqi 3rd Grade Correlation Chart
The statistical analysis conducted on geographies consisting of 471,303,531 people shows a weak positive correlation between the proportion of Immigrants from Philippines and percentage of population with at least 3rd grade education in the United States with a correlation coefficient (R) of 0.278 and weighted average of 97.2%. Similarly, the statistical analysis conducted on geographies consisting of 170,561,413 people shows a poor negative correlation between the proportion of Iraqis and percentage of population with at least 3rd grade education in the United States with a correlation coefficient (R) of -0.141 and weighted average of 97.5%, a difference of 0.39%.
3rd Grade Correlation Summary
| Measurement | Immigrants from Philippines | Iraqi |
| Minimum | 90.6% | 94.2% |
| Maximum | 100.0% | 100.0% |
| Range | 9.4% | 5.8% |
| Mean | 97.3% | 98.0% |
| Median | 97.1% | 98.1% |
| Interquartile 25% (IQ1) | 96.3% | 97.4% |
| Interquartile 75% (IQ3) | 98.6% | 98.7% |
| Interquartile Range (IQR) | 2.3% | 1.3% |
| Standard Deviation (Sample) | 1.8% | 1.2% |
| Standard Deviation (Population) | 1.8% | 1.2% |
Similar Demographics by 3rd Grade
Demographics Similar to Immigrants from Philippines by 3rd Grade
In terms of 3rd grade, the demographic groups most similar to Immigrants from Philippines are Immigrants from Ghana (97.2%, a difference of 0.0%), Immigrants from Bolivia (97.2%, a difference of 0.010%), Trinidadian and Tobagonian (97.2%, a difference of 0.010%), Immigrants from Western Africa (97.2%, a difference of 0.010%), and Barbadian (97.2%, a difference of 0.010%).
| Demographics | Rating | Rank | 3rd Grade |
| Ghanaians | 0.1 /100 | #272 | Tragic 97.2% |
| Immigrants | Peru | 0.1 /100 | #273 | Tragic 97.2% |
| Immigrants | Cameroon | 0.1 /100 | #274 | Tragic 97.2% |
| Immigrants | Uzbekistan | 0.1 /100 | #275 | Tragic 97.2% |
| Immigrants | Bolivia | 0.1 /100 | #276 | Tragic 97.2% |
| Trinidadians and Tobagonians | 0.1 /100 | #277 | Tragic 97.2% |
| Immigrants | Western Africa | 0.1 /100 | #278 | Tragic 97.2% |
| Immigrants | Philippines | 0.1 /100 | #279 | Tragic 97.2% |
| Immigrants | Ghana | 0.1 /100 | #280 | Tragic 97.2% |
| Barbadians | 0.1 /100 | #281 | Tragic 97.2% |
| Afghans | 0.1 /100 | #282 | Tragic 97.1% |
| Houma | 0.1 /100 | #283 | Tragic 97.1% |
| Immigrants | Trinidad and Tobago | 0.0 /100 | #284 | Tragic 97.1% |
| Immigrants | Hong Kong | 0.0 /100 | #285 | Tragic 97.1% |
| Immigrants | Barbados | 0.0 /100 | #286 | Tragic 97.1% |
Demographics Similar to Iraqis by 3rd Grade
In terms of 3rd grade, the demographic groups most similar to Iraqis are Samoan (97.5%, a difference of 0.0%), Immigrants from Bahamas (97.6%, a difference of 0.020%), Moroccan (97.6%, a difference of 0.020%), Yuman (97.6%, a difference of 0.020%), and South American Indian (97.5%, a difference of 0.020%).
| Demographics | Rating | Rank | 3rd Grade |
| Immigrants | Zaire | 11.9 /100 | #208 | Poor 97.6% |
| Costa Ricans | 9.6 /100 | #209 | Tragic 97.6% |
| Immigrants | Oceania | 9.5 /100 | #210 | Tragic 97.6% |
| Laotians | 9.4 /100 | #211 | Tragic 97.6% |
| Immigrants | Bahamas | 8.5 /100 | #212 | Tragic 97.6% |
| Moroccans | 8.5 /100 | #213 | Tragic 97.6% |
| Yuman | 8.4 /100 | #214 | Tragic 97.6% |
| Iraqis | 6.9 /100 | #215 | Tragic 97.5% |
| Samoans | 6.9 /100 | #216 | Tragic 97.5% |
| South American Indians | 5.7 /100 | #217 | Tragic 97.5% |
| Immigrants | Nepal | 5.3 /100 | #218 | Tragic 97.5% |
| Immigrants | Panama | 5.2 /100 | #219 | Tragic 97.5% |
| Immigrants | Morocco | 5.0 /100 | #220 | Tragic 97.5% |
| Uruguayans | 5.0 /100 | #221 | Tragic 97.5% |
| Sierra Leoneans | 4.6 /100 | #222 | Tragic 97.5% |