Immigrants from Panama vs Peruvian Unemployment Among Ages 16 to 19 years
COMPARE
Immigrants from Panama
Peruvian
Unemployment Among Ages 16 to 19 years
Unemployment Among Ages 16 to 19 years Comparison
Immigrants from Panama
Peruvians
19.3%
UNEMPLOYMENT AMONG AGES 16 TO 19 YEARS
0.0/ 100
METRIC RATING
273rd/ 347
METRIC RANK
17.7%
UNEMPLOYMENT AMONG AGES 16 TO 19 YEARS
38.8/ 100
METRIC RATING
194th/ 347
METRIC RANK
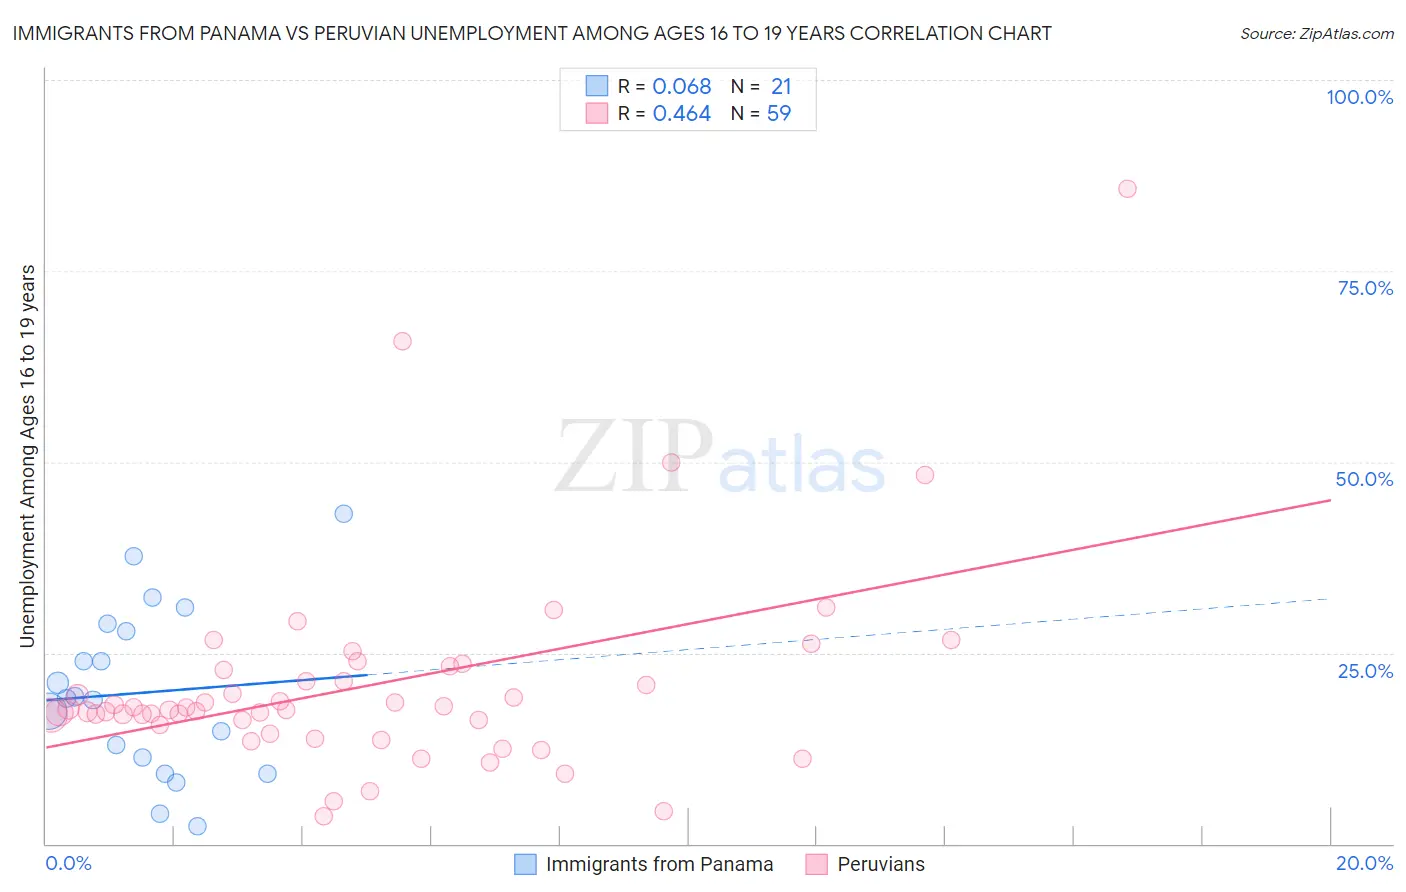
Immigrants from Panama vs Peruvian Unemployment Among Ages 16 to 19 years Correlation Chart
The statistical analysis conducted on geographies consisting of 215,440,567 people shows a slight positive correlation between the proportion of Immigrants from Panama and unemployment rate among population between the ages 16 and 19 in the United States with a correlation coefficient (R) of 0.068 and weighted average of 19.3%. Similarly, the statistical analysis conducted on geographies consisting of 348,011,157 people shows a moderate positive correlation between the proportion of Peruvians and unemployment rate among population between the ages 16 and 19 in the United States with a correlation coefficient (R) of 0.464 and weighted average of 17.7%, a difference of 9.1%.
Unemployment Among Ages 16 to 19 years Correlation Summary
| Measurement | Immigrants from Panama | Peruvian |
| Minimum | 2.3% | 3.6% |
| Maximum | 43.2% | 85.7% |
| Range | 40.9% | 82.1% |
| Mean | 19.8% | 20.7% |
| Median | 19.1% | 17.5% |
| Interquartile 25% (IQ1) | 10.2% | 15.6% |
| Interquartile 75% (IQ3) | 28.4% | 22.8% |
| Interquartile Range (IQR) | 18.2% | 7.2% |
| Standard Deviation (Sample) | 11.0% | 13.3% |
| Standard Deviation (Population) | 10.7% | 13.2% |
Similar Demographics by Unemployment Among Ages 16 to 19 years
Demographics Similar to Immigrants from Panama by Unemployment Among Ages 16 to 19 years
In terms of unemployment among ages 16 to 19 years, the demographic groups most similar to Immigrants from Panama are Hispanic or Latino (19.2%, a difference of 0.13%), Shoshone (19.3%, a difference of 0.15%), Blackfeet (19.2%, a difference of 0.25%), Paraguayan (19.4%, a difference of 0.47%), and Immigrants from Latin America (19.4%, a difference of 0.57%).
| Demographics | Rating | Rank | Unemployment Among Ages 16 to 19 years |
| Immigrants | Honduras | 0.1 /100 | #266 | Tragic 19.0% |
| Israelis | 0.1 /100 | #267 | Tragic 19.0% |
| Immigrants | El Salvador | 0.1 /100 | #268 | Tragic 19.1% |
| Lumbee | 0.1 /100 | #269 | Tragic 19.1% |
| Hondurans | 0.1 /100 | #270 | Tragic 19.2% |
| Blackfeet | 0.0 /100 | #271 | Tragic 19.2% |
| Hispanics or Latinos | 0.0 /100 | #272 | Tragic 19.2% |
| Immigrants | Panama | 0.0 /100 | #273 | Tragic 19.3% |
| Shoshone | 0.0 /100 | #274 | Tragic 19.3% |
| Paraguayans | 0.0 /100 | #275 | Tragic 19.4% |
| Immigrants | Latin America | 0.0 /100 | #276 | Tragic 19.4% |
| Immigrants | Western Africa | 0.0 /100 | #277 | Tragic 19.4% |
| Africans | 0.0 /100 | #278 | Tragic 19.5% |
| Ute | 0.0 /100 | #279 | Tragic 19.6% |
| Cajuns | 0.0 /100 | #280 | Tragic 19.6% |
Demographics Similar to Peruvians by Unemployment Among Ages 16 to 19 years
In terms of unemployment among ages 16 to 19 years, the demographic groups most similar to Peruvians are Immigrants from Peru (17.7%, a difference of 0.070%), Immigrants from Australia (17.7%, a difference of 0.090%), Immigrants from Philippines (17.7%, a difference of 0.10%), Immigrants from Costa Rica (17.6%, a difference of 0.12%), and Marshallese (17.6%, a difference of 0.14%).
| Demographics | Rating | Rank | Unemployment Among Ages 16 to 19 years |
| Immigrants | Micronesia | 42.4 /100 | #187 | Average 17.6% |
| Immigrants | Nicaragua | 42.2 /100 | #188 | Average 17.6% |
| Immigrants | Europe | 41.8 /100 | #189 | Average 17.6% |
| Marshallese | 41.7 /100 | #190 | Average 17.6% |
| Immigrants | Costa Rica | 41.3 /100 | #191 | Average 17.6% |
| Immigrants | Philippines | 40.7 /100 | #192 | Average 17.7% |
| Immigrants | Australia | 40.6 /100 | #193 | Average 17.7% |
| Peruvians | 38.8 /100 | #194 | Fair 17.7% |
| Immigrants | Peru | 37.3 /100 | #195 | Fair 17.7% |
| Alaskan Athabascans | 34.1 /100 | #196 | Fair 17.7% |
| Immigrants | Czechoslovakia | 29.8 /100 | #197 | Fair 17.8% |
| Ethiopians | 29.6 /100 | #198 | Fair 17.8% |
| Immigrants | Ireland | 28.5 /100 | #199 | Fair 17.8% |
| Immigrants | Fiji | 27.7 /100 | #200 | Fair 17.8% |
| Immigrants | Ethiopia | 27.4 /100 | #201 | Fair 17.8% |