Chippewa vs Peruvian Unemployment Among Ages 16 to 19 years
COMPARE
Chippewa
Peruvian
Unemployment Among Ages 16 to 19 years
Unemployment Among Ages 16 to 19 years Comparison
Chippewa
Peruvians
18.0%
UNEMPLOYMENT AMONG AGES 16 TO 19 YEARS
13.7/ 100
METRIC RATING
213th/ 347
METRIC RANK
17.7%
UNEMPLOYMENT AMONG AGES 16 TO 19 YEARS
38.8/ 100
METRIC RATING
194th/ 347
METRIC RANK
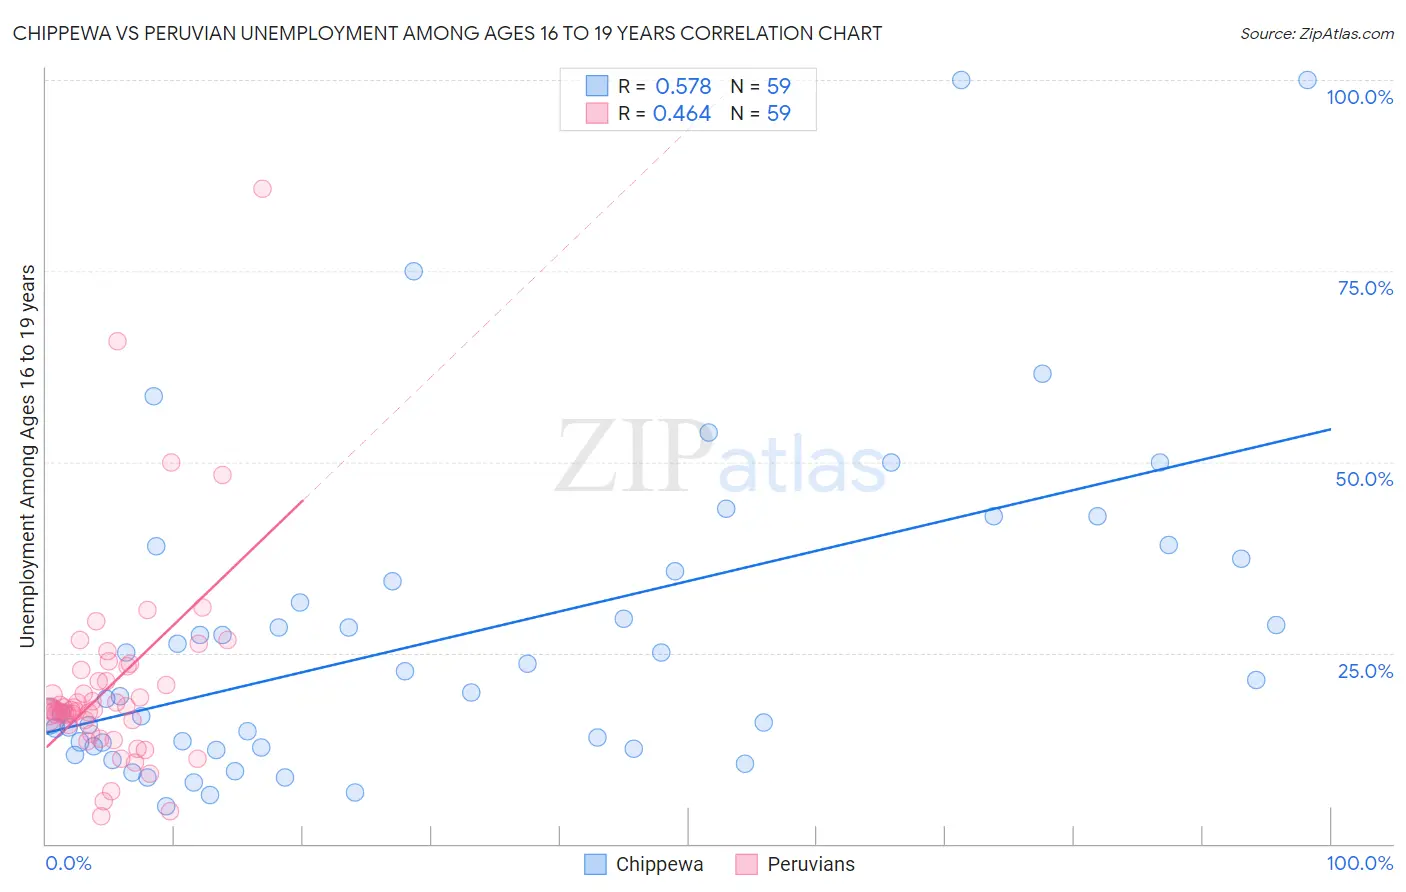
Chippewa vs Peruvian Unemployment Among Ages 16 to 19 years Correlation Chart
The statistical analysis conducted on geographies consisting of 207,549,693 people shows a substantial positive correlation between the proportion of Chippewa and unemployment rate among population between the ages 16 and 19 in the United States with a correlation coefficient (R) of 0.578 and weighted average of 18.0%. Similarly, the statistical analysis conducted on geographies consisting of 348,011,157 people shows a moderate positive correlation between the proportion of Peruvians and unemployment rate among population between the ages 16 and 19 in the United States with a correlation coefficient (R) of 0.464 and weighted average of 17.7%, a difference of 1.6%.
Unemployment Among Ages 16 to 19 years Correlation Summary
| Measurement | Chippewa | Peruvian |
| Minimum | 4.9% | 3.6% |
| Maximum | 100.0% | 85.7% |
| Range | 95.1% | 82.1% |
| Mean | 27.0% | 20.7% |
| Median | 19.7% | 17.5% |
| Interquartile 25% (IQ1) | 12.7% | 15.6% |
| Interquartile 75% (IQ3) | 35.6% | 22.8% |
| Interquartile Range (IQR) | 22.9% | 7.2% |
| Standard Deviation (Sample) | 20.7% | 13.3% |
| Standard Deviation (Population) | 20.5% | 13.2% |
Demographics Similar to Chippewa and Peruvians by Unemployment Among Ages 16 to 19 years
In terms of unemployment among ages 16 to 19 years, the demographic groups most similar to Chippewa are Argentinean (18.0%, a difference of 0.010%), Guamanian/Chamorro (17.9%, a difference of 0.070%), Carpatho Rusyn (17.9%, a difference of 0.17%), Cherokee (17.9%, a difference of 0.18%), and Hawaiian (17.9%, a difference of 0.27%). Similarly, the demographic groups most similar to Peruvians are Immigrants from Peru (17.7%, a difference of 0.070%), Immigrants from Australia (17.7%, a difference of 0.090%), Alaskan Athabascan (17.7%, a difference of 0.24%), Immigrants from Czechoslovakia (17.8%, a difference of 0.47%), and Ethiopian (17.8%, a difference of 0.48%).
| Demographics | Rating | Rank | Unemployment Among Ages 16 to 19 years |
| Immigrants | Australia | 40.6 /100 | #193 | Average 17.7% |
| Peruvians | 38.8 /100 | #194 | Fair 17.7% |
| Immigrants | Peru | 37.3 /100 | #195 | Fair 17.7% |
| Alaskan Athabascans | 34.1 /100 | #196 | Fair 17.7% |
| Immigrants | Czechoslovakia | 29.8 /100 | #197 | Fair 17.8% |
| Ethiopians | 29.6 /100 | #198 | Fair 17.8% |
| Immigrants | Ireland | 28.5 /100 | #199 | Fair 17.8% |
| Immigrants | Fiji | 27.7 /100 | #200 | Fair 17.8% |
| Immigrants | Ethiopia | 27.4 /100 | #201 | Fair 17.8% |
| Immigrants | Portugal | 27.2 /100 | #202 | Fair 17.8% |
| Immigrants | Eastern Europe | 23.6 /100 | #203 | Fair 17.8% |
| Immigrants | Nonimmigrants | 20.9 /100 | #204 | Fair 17.9% |
| Assyrians/Chaldeans/Syriacs | 20.8 /100 | #205 | Fair 17.9% |
| Immigrants | Southern Europe | 18.9 /100 | #206 | Poor 17.9% |
| Liberians | 18.6 /100 | #207 | Poor 17.9% |
| Hawaiians | 16.8 /100 | #208 | Poor 17.9% |
| Cherokee | 15.7 /100 | #209 | Poor 17.9% |
| Carpatho Rusyns | 15.6 /100 | #210 | Poor 17.9% |
| Guamanians/Chamorros | 14.5 /100 | #211 | Poor 17.9% |
| Argentineans | 13.8 /100 | #212 | Poor 18.0% |
| Chippewa | 13.7 /100 | #213 | Poor 18.0% |