Immigrants from Pakistan vs Sudanese Unemployment Among Ages 35 to 44 years
COMPARE
Immigrants from Pakistan
Sudanese
Unemployment Among Ages 35 to 44 years
Unemployment Among Ages 35 to 44 years Comparison
Immigrants from Pakistan
Sudanese
4.3%
UNEMPLOYMENT AMONG AGES 35 TO 44 YEARS
99.2/ 100
METRIC RATING
30th/ 347
METRIC RANK
4.1%
UNEMPLOYMENT AMONG AGES 35 TO 44 YEARS
99.9/ 100
METRIC RATING
11th/ 347
METRIC RANK
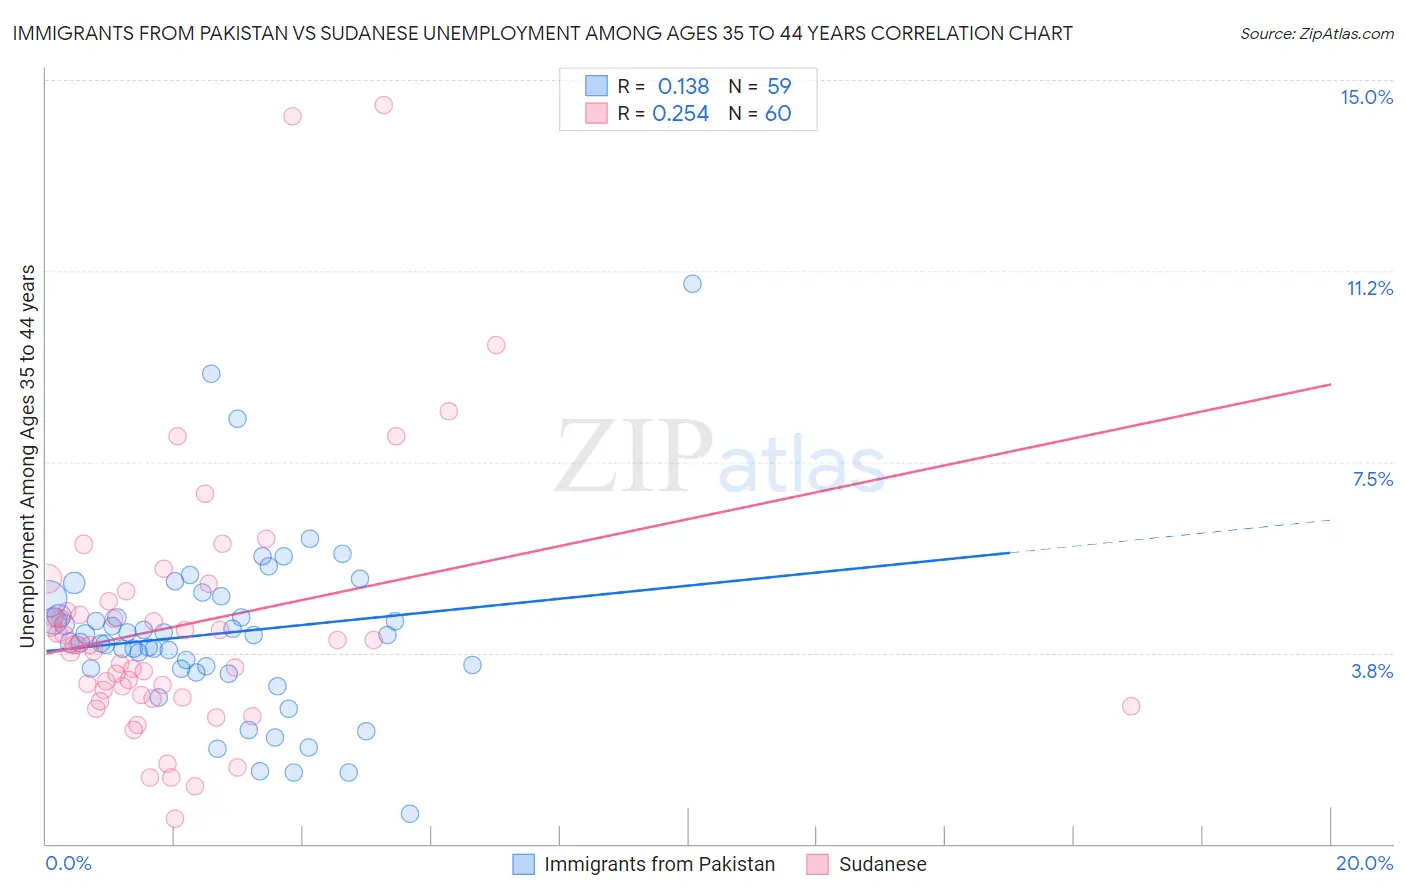
Immigrants from Pakistan vs Sudanese Unemployment Among Ages 35 to 44 years Correlation Chart
The statistical analysis conducted on geographies consisting of 280,835,646 people shows a poor positive correlation between the proportion of Immigrants from Pakistan and unemployment rate among population between the ages 35 and 44 in the United States with a correlation coefficient (R) of 0.138 and weighted average of 4.3%. Similarly, the statistical analysis conducted on geographies consisting of 109,577,275 people shows a weak positive correlation between the proportion of Sudanese and unemployment rate among population between the ages 35 and 44 in the United States with a correlation coefficient (R) of 0.254 and weighted average of 4.1%, a difference of 3.8%.
Unemployment Among Ages 35 to 44 years Correlation Summary
| Measurement | Immigrants from Pakistan | Sudanese |
| Minimum | 0.60% | 0.50% |
| Maximum | 11.0% | 14.5% |
| Range | 10.4% | 14.0% |
| Mean | 4.1% | 4.3% |
| Median | 4.1% | 3.9% |
| Interquartile 25% (IQ1) | 3.4% | 2.9% |
| Interquartile 75% (IQ3) | 4.8% | 4.7% |
| Interquartile Range (IQR) | 1.4% | 1.8% |
| Standard Deviation (Sample) | 1.7% | 2.6% |
| Standard Deviation (Population) | 1.7% | 2.6% |
Demographics Similar to Immigrants from Pakistan and Sudanese by Unemployment Among Ages 35 to 44 years
In terms of unemployment among ages 35 to 44 years, the demographic groups most similar to Immigrants from Pakistan are European (4.3%, a difference of 0.070%), Immigrants from Japan (4.3%, a difference of 0.26%), Assyrian/Chaldean/Syriac (4.3%, a difference of 0.34%), Turkish (4.3%, a difference of 0.36%), and Bulgarian (4.3%, a difference of 0.42%). Similarly, the demographic groups most similar to Sudanese are Immigrants from Singapore (4.1%, a difference of 0.070%), Venezuelan (4.1%, a difference of 0.10%), Bolivian (4.1%, a difference of 0.14%), Czech (4.1%, a difference of 0.24%), and Tongan (4.2%, a difference of 0.33%).
| Demographics | Rating | Rank | Unemployment Among Ages 35 to 44 years |
| Immigrants | Singapore | 99.9 /100 | #10 | Exceptional 4.1% |
| Sudanese | 99.9 /100 | #11 | Exceptional 4.1% |
| Venezuelans | 99.9 /100 | #12 | Exceptional 4.1% |
| Bolivians | 99.9 /100 | #13 | Exceptional 4.1% |
| Czechs | 99.9 /100 | #14 | Exceptional 4.1% |
| Tongans | 99.8 /100 | #15 | Exceptional 4.2% |
| Cubans | 99.8 /100 | #16 | Exceptional 4.2% |
| Swedes | 99.8 /100 | #17 | Exceptional 4.2% |
| Latvians | 99.8 /100 | #18 | Exceptional 4.2% |
| Immigrants | Nepal | 99.7 /100 | #19 | Exceptional 4.2% |
| Immigrants | Bolivia | 99.7 /100 | #20 | Exceptional 4.2% |
| Paraguayans | 99.6 /100 | #21 | Exceptional 4.2% |
| Scandinavians | 99.5 /100 | #22 | Exceptional 4.2% |
| Immigrants | Kuwait | 99.5 /100 | #23 | Exceptional 4.3% |
| Tlingit-Haida | 99.5 /100 | #24 | Exceptional 4.3% |
| Bulgarians | 99.3 /100 | #25 | Exceptional 4.3% |
| Turks | 99.3 /100 | #26 | Exceptional 4.3% |
| Assyrians/Chaldeans/Syriacs | 99.3 /100 | #27 | Exceptional 4.3% |
| Immigrants | Japan | 99.3 /100 | #28 | Exceptional 4.3% |
| Europeans | 99.2 /100 | #29 | Exceptional 4.3% |
| Immigrants | Pakistan | 99.2 /100 | #30 | Exceptional 4.3% |