Immigrants from India vs Sudanese Unemployment Among Ages 35 to 44 years
COMPARE
Immigrants from India
Sudanese
Unemployment Among Ages 35 to 44 years
Unemployment Among Ages 35 to 44 years Comparison
Immigrants from India
Sudanese
3.8%
UNEMPLOYMENT AMONG AGES 35 TO 44 YEARS
100.0/ 100
METRIC RATING
1st/ 347
METRIC RANK
4.1%
UNEMPLOYMENT AMONG AGES 35 TO 44 YEARS
99.9/ 100
METRIC RATING
11th/ 347
METRIC RANK
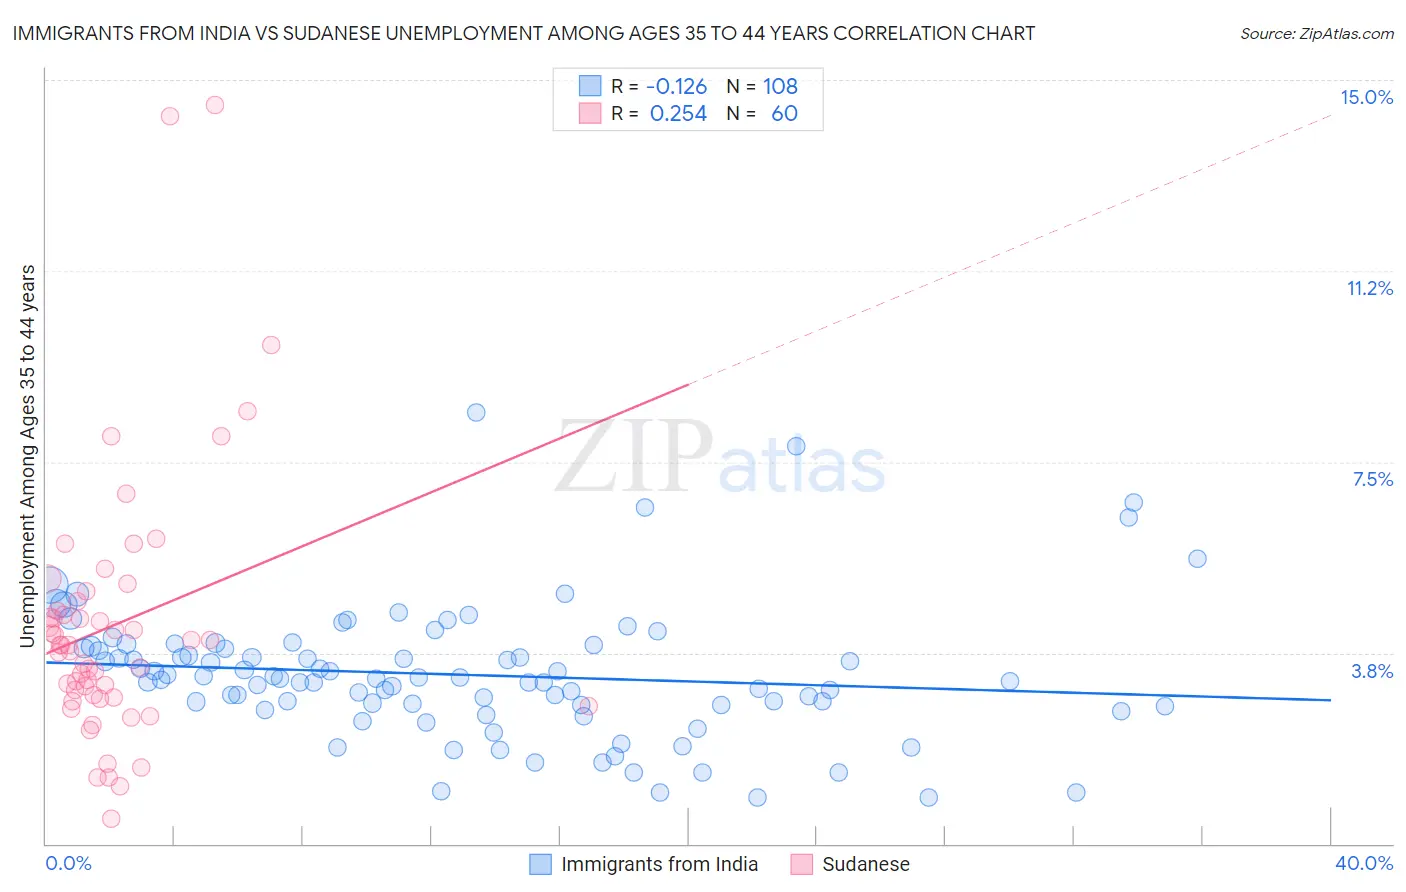
Immigrants from India vs Sudanese Unemployment Among Ages 35 to 44 years Correlation Chart
The statistical analysis conducted on geographies consisting of 422,780,739 people shows a poor negative correlation between the proportion of Immigrants from India and unemployment rate among population between the ages 35 and 44 in the United States with a correlation coefficient (R) of -0.126 and weighted average of 3.8%. Similarly, the statistical analysis conducted on geographies consisting of 109,577,275 people shows a weak positive correlation between the proportion of Sudanese and unemployment rate among population between the ages 35 and 44 in the United States with a correlation coefficient (R) of 0.254 and weighted average of 4.1%, a difference of 10.0%.
Unemployment Among Ages 35 to 44 years Correlation Summary
| Measurement | Immigrants from India | Sudanese |
| Minimum | 0.90% | 0.50% |
| Maximum | 8.5% | 14.5% |
| Range | 7.6% | 14.0% |
| Mean | 3.3% | 4.3% |
| Median | 3.2% | 3.9% |
| Interquartile 25% (IQ1) | 2.7% | 2.9% |
| Interquartile 75% (IQ3) | 3.9% | 4.7% |
| Interquartile Range (IQR) | 1.1% | 1.8% |
| Standard Deviation (Sample) | 1.3% | 2.6% |
| Standard Deviation (Population) | 1.3% | 2.6% |
Demographics Similar to Immigrants from India and Sudanese by Unemployment Among Ages 35 to 44 years
In terms of unemployment among ages 35 to 44 years, the demographic groups most similar to Immigrants from India are Thai (3.9%, a difference of 4.8%), Norwegian (4.0%, a difference of 6.3%), Immigrants from Taiwan (4.0%, a difference of 6.9%), Filipino (4.0%, a difference of 7.6%), and Immigrants from Venezuela (4.0%, a difference of 7.7%). Similarly, the demographic groups most similar to Sudanese are Immigrants from Singapore (4.1%, a difference of 0.070%), Venezuelan (4.1%, a difference of 0.10%), Bolivian (4.1%, a difference of 0.14%), Czech (4.1%, a difference of 0.24%), and Tongan (4.2%, a difference of 0.33%).
| Demographics | Rating | Rank | Unemployment Among Ages 35 to 44 years |
| Immigrants | India | 100.0 /100 | #1 | Exceptional 3.8% |
| Thais | 100.0 /100 | #2 | Exceptional 3.9% |
| Norwegians | 100.0 /100 | #3 | Exceptional 4.0% |
| Immigrants | Taiwan | 100.0 /100 | #4 | Exceptional 4.0% |
| Filipinos | 100.0 /100 | #5 | Exceptional 4.0% |
| Immigrants | Venezuela | 100.0 /100 | #6 | Exceptional 4.0% |
| Immigrants | Cuba | 99.9 /100 | #7 | Exceptional 4.1% |
| Immigrants | South Central Asia | 99.9 /100 | #8 | Exceptional 4.1% |
| Danes | 99.9 /100 | #9 | Exceptional 4.1% |
| Immigrants | Singapore | 99.9 /100 | #10 | Exceptional 4.1% |
| Sudanese | 99.9 /100 | #11 | Exceptional 4.1% |
| Venezuelans | 99.9 /100 | #12 | Exceptional 4.1% |
| Bolivians | 99.9 /100 | #13 | Exceptional 4.1% |
| Czechs | 99.9 /100 | #14 | Exceptional 4.1% |
| Tongans | 99.8 /100 | #15 | Exceptional 4.2% |
| Cubans | 99.8 /100 | #16 | Exceptional 4.2% |
| Swedes | 99.8 /100 | #17 | Exceptional 4.2% |
| Latvians | 99.8 /100 | #18 | Exceptional 4.2% |
| Immigrants | Nepal | 99.7 /100 | #19 | Exceptional 4.2% |
| Immigrants | Bolivia | 99.7 /100 | #20 | Exceptional 4.2% |