Immigrants from North America vs Spanish American Unemployment Among Ages 25 to 29 years
COMPARE
Immigrants from North America
Spanish American
Unemployment Among Ages 25 to 29 years
Unemployment Among Ages 25 to 29 years Comparison
Immigrants from North America
Spanish Americans
6.6%
UNEMPLOYMENT AMONG AGES 25 TO 29 YEARS
50.0/ 100
METRIC RATING
174th/ 347
METRIC RANK
7.0%
UNEMPLOYMENT AMONG AGES 25 TO 29 YEARS
2.7/ 100
METRIC RATING
232nd/ 347
METRIC RANK
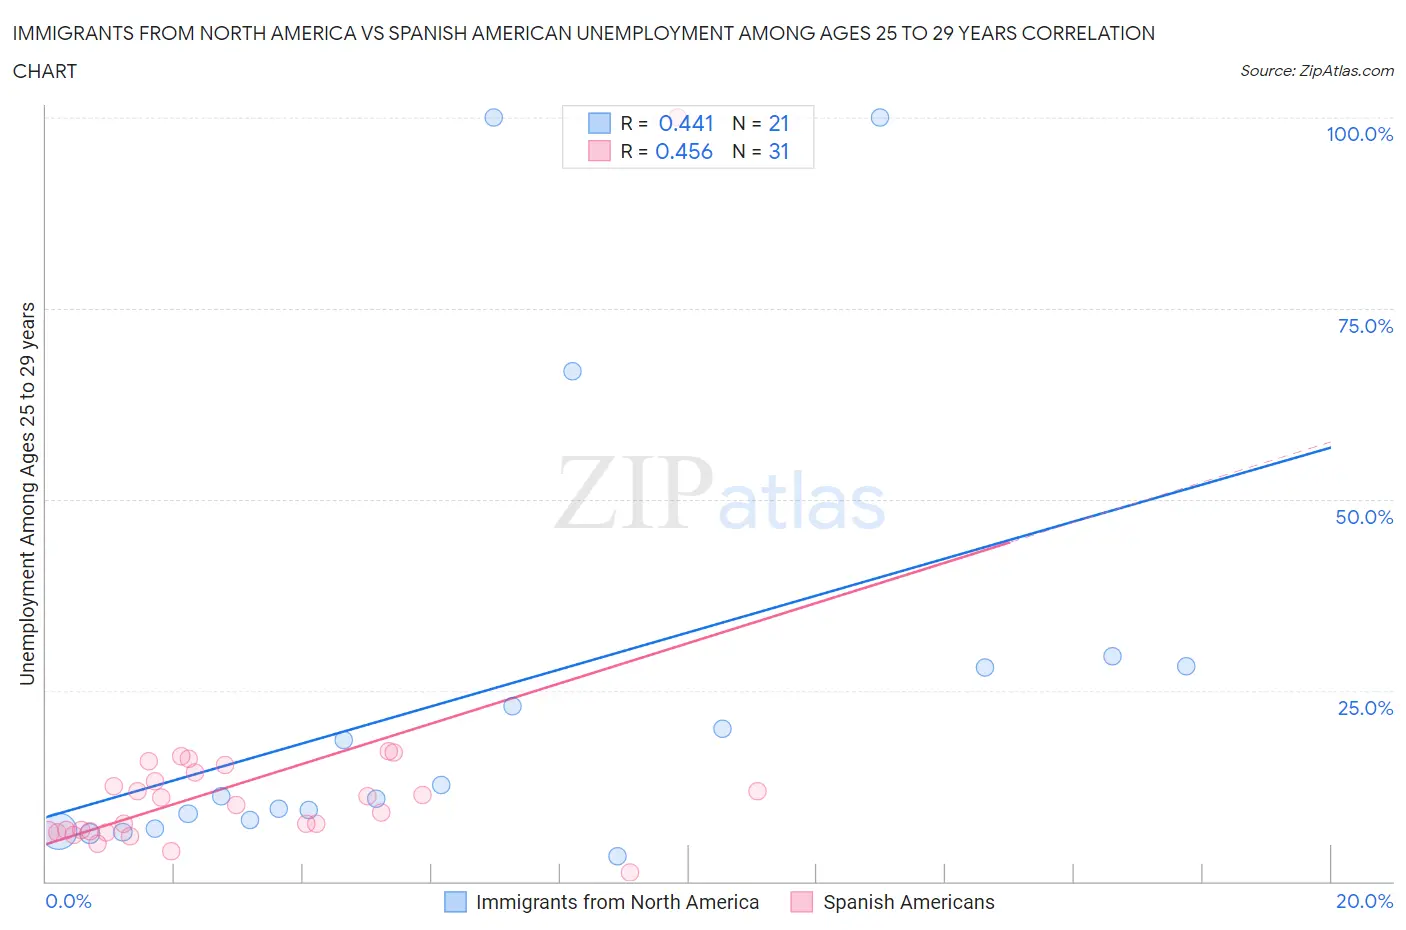
Immigrants from North America vs Spanish American Unemployment Among Ages 25 to 29 years Correlation Chart
The statistical analysis conducted on geographies consisting of 430,461,611 people shows a moderate positive correlation between the proportion of Immigrants from North America and unemployment rate among population between the ages 25 and 29 in the United States with a correlation coefficient (R) of 0.441 and weighted average of 6.6%. Similarly, the statistical analysis conducted on geographies consisting of 101,823,557 people shows a moderate positive correlation between the proportion of Spanish Americans and unemployment rate among population between the ages 25 and 29 in the United States with a correlation coefficient (R) of 0.456 and weighted average of 7.0%, a difference of 5.5%.
Unemployment Among Ages 25 to 29 years Correlation Summary
| Measurement | Immigrants from North America | Spanish American |
| Minimum | 3.2% | 1.1% |
| Maximum | 100.0% | 100.0% |
| Range | 96.8% | 98.9% |
| Mean | 24.4% | 12.8% |
| Median | 11.1% | 9.9% |
| Interquartile 25% (IQ1) | 7.4% | 6.5% |
| Interquartile 75% (IQ3) | 28.1% | 14.2% |
| Interquartile Range (IQR) | 20.6% | 7.7% |
| Standard Deviation (Sample) | 28.7% | 16.7% |
| Standard Deviation (Population) | 28.0% | 16.5% |
Similar Demographics by Unemployment Among Ages 25 to 29 years
Demographics Similar to Immigrants from North America by Unemployment Among Ages 25 to 29 years
In terms of unemployment among ages 25 to 29 years, the demographic groups most similar to Immigrants from North America are Immigrants from South Eastern Asia (6.7%, a difference of 0.060%), Russian (6.6%, a difference of 0.080%), Bangladeshi (6.6%, a difference of 0.10%), Osage (6.7%, a difference of 0.12%), and Immigrants from Israel (6.7%, a difference of 0.14%).
| Demographics | Rating | Rank | Unemployment Among Ages 25 to 29 years |
| Immigrants | Canada | 55.0 /100 | #167 | Average 6.6% |
| Estonians | 54.8 /100 | #168 | Average 6.6% |
| South Americans | 54.5 /100 | #169 | Average 6.6% |
| Albanians | 53.5 /100 | #170 | Average 6.6% |
| Immigrants | Cambodia | 52.6 /100 | #171 | Average 6.6% |
| Bangladeshis | 51.6 /100 | #172 | Average 6.6% |
| Russians | 51.3 /100 | #173 | Average 6.6% |
| Immigrants | North America | 50.0 /100 | #174 | Average 6.6% |
| Immigrants | South Eastern Asia | 49.1 /100 | #175 | Average 6.7% |
| Osage | 48.1 /100 | #176 | Average 6.7% |
| Immigrants | Israel | 47.8 /100 | #177 | Average 6.7% |
| Immigrants | Iraq | 45.1 /100 | #178 | Average 6.7% |
| Costa Ricans | 44.9 /100 | #179 | Average 6.7% |
| Immigrants | Africa | 41.1 /100 | #180 | Average 6.7% |
| Immigrants | Western Europe | 41.1 /100 | #181 | Average 6.7% |
Demographics Similar to Spanish Americans by Unemployment Among Ages 25 to 29 years
In terms of unemployment among ages 25 to 29 years, the demographic groups most similar to Spanish Americans are Central American (7.0%, a difference of 0.15%), Immigrants from Honduras (7.0%, a difference of 0.19%), French Canadian (7.0%, a difference of 0.21%), Panamanian (7.0%, a difference of 0.37%), and Immigrants from El Salvador (7.0%, a difference of 0.44%).
| Demographics | Rating | Rank | Unemployment Among Ages 25 to 29 years |
| Japanese | 5.4 /100 | #225 | Tragic 6.9% |
| Immigrants | Liberia | 4.8 /100 | #226 | Tragic 7.0% |
| Salvadorans | 4.4 /100 | #227 | Tragic 7.0% |
| Immigrants | Panama | 4.2 /100 | #228 | Tragic 7.0% |
| Bermudans | 3.8 /100 | #229 | Tragic 7.0% |
| Immigrants | El Salvador | 3.6 /100 | #230 | Tragic 7.0% |
| Central Americans | 3.0 /100 | #231 | Tragic 7.0% |
| Spanish Americans | 2.7 /100 | #232 | Tragic 7.0% |
| Immigrants | Honduras | 2.4 /100 | #233 | Tragic 7.0% |
| French Canadians | 2.4 /100 | #234 | Tragic 7.0% |
| Panamanians | 2.1 /100 | #235 | Tragic 7.0% |
| Cape Verdeans | 1.9 /100 | #236 | Tragic 7.0% |
| Puget Sound Salish | 1.8 /100 | #237 | Tragic 7.1% |
| Hondurans | 1.8 /100 | #238 | Tragic 7.1% |
| Potawatomi | 1.3 /100 | #239 | Tragic 7.1% |