Immigrants from England vs Spanish American Unemployment Among Ages 25 to 29 years
COMPARE
Immigrants from England
Spanish American
Unemployment Among Ages 25 to 29 years
Unemployment Among Ages 25 to 29 years Comparison
Immigrants from England
Spanish Americans
6.8%
UNEMPLOYMENT AMONG AGES 25 TO 29 YEARS
19.8/ 100
METRIC RATING
205th/ 347
METRIC RANK
7.0%
UNEMPLOYMENT AMONG AGES 25 TO 29 YEARS
2.7/ 100
METRIC RATING
232nd/ 347
METRIC RANK
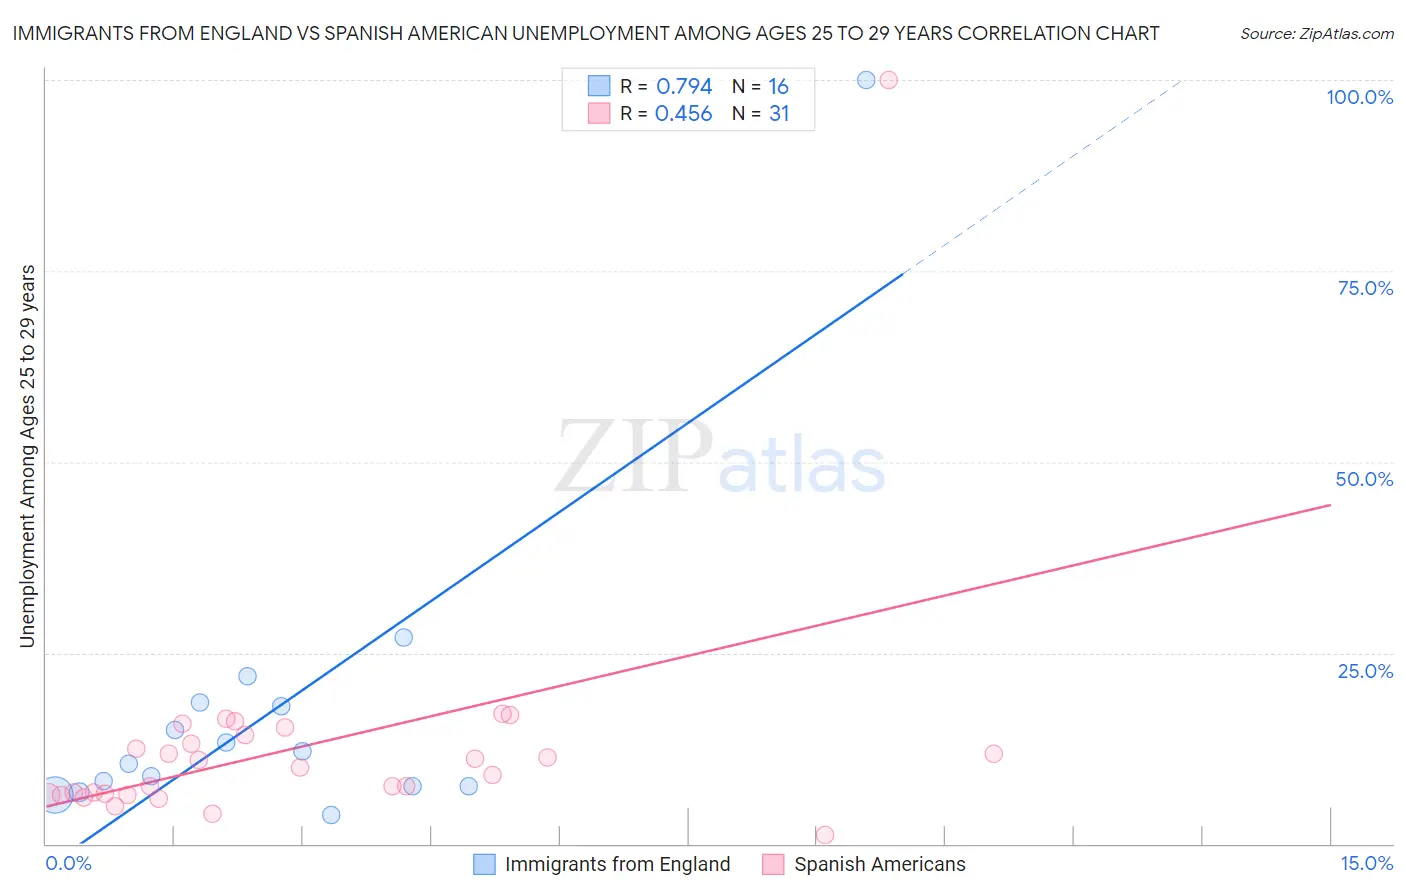
Immigrants from England vs Spanish American Unemployment Among Ages 25 to 29 years Correlation Chart
The statistical analysis conducted on geographies consisting of 370,546,883 people shows a strong positive correlation between the proportion of Immigrants from England and unemployment rate among population between the ages 25 and 29 in the United States with a correlation coefficient (R) of 0.794 and weighted average of 6.8%. Similarly, the statistical analysis conducted on geographies consisting of 101,823,557 people shows a moderate positive correlation between the proportion of Spanish Americans and unemployment rate among population between the ages 25 and 29 in the United States with a correlation coefficient (R) of 0.456 and weighted average of 7.0%, a difference of 3.3%.
Unemployment Among Ages 25 to 29 years Correlation Summary
| Measurement | Immigrants from England | Spanish American |
| Minimum | 3.8% | 1.1% |
| Maximum | 100.0% | 100.0% |
| Range | 96.2% | 98.9% |
| Mean | 17.8% | 12.8% |
| Median | 11.2% | 9.9% |
| Interquartile 25% (IQ1) | 7.6% | 6.5% |
| Interquartile 75% (IQ3) | 18.3% | 14.2% |
| Interquartile Range (IQR) | 10.7% | 7.7% |
| Standard Deviation (Sample) | 22.8% | 16.7% |
| Standard Deviation (Population) | 22.1% | 16.5% |
Similar Demographics by Unemployment Among Ages 25 to 29 years
Demographics Similar to Immigrants from England by Unemployment Among Ages 25 to 29 years
In terms of unemployment among ages 25 to 29 years, the demographic groups most similar to Immigrants from England are Scotch-Irish (6.8%, a difference of 0.010%), Ugandan (6.8%, a difference of 0.010%), Immigrants from Denmark (6.8%, a difference of 0.080%), Immigrants from Germany (6.8%, a difference of 0.10%), and Immigrants from Norway (6.8%, a difference of 0.13%).
| Demographics | Rating | Rank | Unemployment Among Ages 25 to 29 years |
| Immigrants | Southern Europe | 24.6 /100 | #198 | Fair 6.8% |
| Guamanians/Chamorros | 24.3 /100 | #199 | Fair 6.8% |
| South American Indians | 23.3 /100 | #200 | Fair 6.8% |
| Basques | 22.5 /100 | #201 | Fair 6.8% |
| Immigrants | Argentina | 21.6 /100 | #202 | Fair 6.8% |
| Immigrants | Norway | 21.2 /100 | #203 | Fair 6.8% |
| Scotch-Irish | 20.0 /100 | #204 | Poor 6.8% |
| Immigrants | England | 19.8 /100 | #205 | Poor 6.8% |
| Ugandans | 19.8 /100 | #206 | Poor 6.8% |
| Immigrants | Denmark | 19.0 /100 | #207 | Poor 6.8% |
| Immigrants | Germany | 18.8 /100 | #208 | Poor 6.8% |
| Hawaiians | 17.1 /100 | #209 | Poor 6.8% |
| Canadians | 16.9 /100 | #210 | Poor 6.8% |
| Immigrants | Philippines | 16.7 /100 | #211 | Poor 6.8% |
| Immigrants | Cabo Verde | 16.2 /100 | #212 | Poor 6.8% |
Demographics Similar to Spanish Americans by Unemployment Among Ages 25 to 29 years
In terms of unemployment among ages 25 to 29 years, the demographic groups most similar to Spanish Americans are Central American (7.0%, a difference of 0.15%), Immigrants from Honduras (7.0%, a difference of 0.19%), French Canadian (7.0%, a difference of 0.21%), Panamanian (7.0%, a difference of 0.37%), and Immigrants from El Salvador (7.0%, a difference of 0.44%).
| Demographics | Rating | Rank | Unemployment Among Ages 25 to 29 years |
| Japanese | 5.4 /100 | #225 | Tragic 6.9% |
| Immigrants | Liberia | 4.8 /100 | #226 | Tragic 7.0% |
| Salvadorans | 4.4 /100 | #227 | Tragic 7.0% |
| Immigrants | Panama | 4.2 /100 | #228 | Tragic 7.0% |
| Bermudans | 3.8 /100 | #229 | Tragic 7.0% |
| Immigrants | El Salvador | 3.6 /100 | #230 | Tragic 7.0% |
| Central Americans | 3.0 /100 | #231 | Tragic 7.0% |
| Spanish Americans | 2.7 /100 | #232 | Tragic 7.0% |
| Immigrants | Honduras | 2.4 /100 | #233 | Tragic 7.0% |
| French Canadians | 2.4 /100 | #234 | Tragic 7.0% |
| Panamanians | 2.1 /100 | #235 | Tragic 7.0% |
| Cape Verdeans | 1.9 /100 | #236 | Tragic 7.0% |
| Puget Sound Salish | 1.8 /100 | #237 | Tragic 7.1% |
| Hondurans | 1.8 /100 | #238 | Tragic 7.1% |
| Potawatomi | 1.3 /100 | #239 | Tragic 7.1% |