Immigrants from Moldova vs Immigrants from Norway Unemployment Among Women with Children Ages 6 to 17 years
COMPARE
Immigrants from Moldova
Immigrants from Norway
Unemployment Among Women with Children Ages 6 to 17 years
Unemployment Among Women with Children Ages 6 to 17 years Comparison
Immigrants from Moldova
Immigrants from Norway
8.4%
UNEMPLOYMENT AMONG WOMEN WITH CHILDREN AGES 6 TO 17 YEARS
99.7/ 100
METRIC RATING
76th/ 347
METRIC RANK
8.6%
UNEMPLOYMENT AMONG WOMEN WITH CHILDREN AGES 6 TO 17 YEARS
97.8/ 100
METRIC RATING
105th/ 347
METRIC RANK
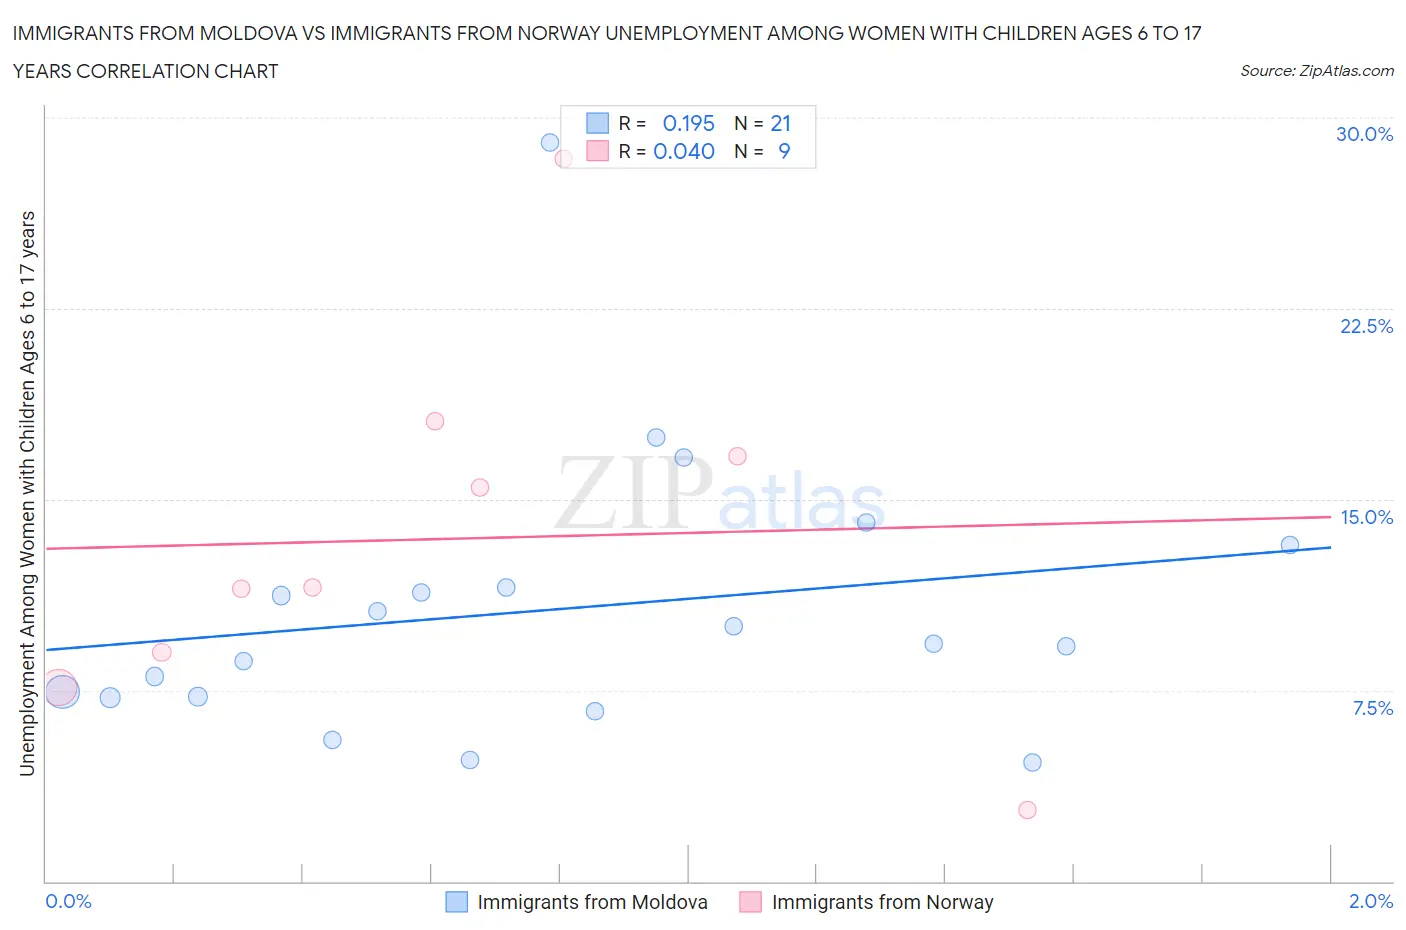
Immigrants from Moldova vs Immigrants from Norway Unemployment Among Women with Children Ages 6 to 17 years Correlation Chart
The statistical analysis conducted on geographies consisting of 104,002,938 people shows a poor positive correlation between the proportion of Immigrants from Moldova and unemployment rate among women with children between the ages 6 and 17 in the United States with a correlation coefficient (R) of 0.195 and weighted average of 8.4%. Similarly, the statistical analysis conducted on geographies consisting of 97,676,556 people shows no correlation between the proportion of Immigrants from Norway and unemployment rate among women with children between the ages 6 and 17 in the United States with a correlation coefficient (R) of 0.040 and weighted average of 8.6%, a difference of 2.4%.
Unemployment Among Women with Children Ages 6 to 17 years Correlation Summary
| Measurement | Immigrants from Moldova | Immigrants from Norway |
| Minimum | 4.7% | 2.8% |
| Maximum | 29.0% | 28.4% |
| Range | 24.3% | 25.6% |
| Mean | 10.7% | 13.5% |
| Median | 9.3% | 11.5% |
| Interquartile 25% (IQ1) | 7.2% | 8.3% |
| Interquartile 75% (IQ3) | 12.4% | 17.4% |
| Interquartile Range (IQR) | 5.1% | 9.1% |
| Standard Deviation (Sample) | 5.5% | 7.4% |
| Standard Deviation (Population) | 5.3% | 6.9% |
Similar Demographics by Unemployment Among Women with Children Ages 6 to 17 years
Demographics Similar to Immigrants from Moldova by Unemployment Among Women with Children Ages 6 to 17 years
In terms of unemployment among women with children ages 6 to 17 years, the demographic groups most similar to Immigrants from Moldova are Immigrants from Sri Lanka (8.4%, a difference of 0.020%), Iraqi (8.4%, a difference of 0.050%), Samoan (8.4%, a difference of 0.11%), Pakistani (8.4%, a difference of 0.19%), and Mongolian (8.4%, a difference of 0.20%).
| Demographics | Rating | Rank | Unemployment Among Women with Children Ages 6 to 17 years |
| Immigrants | Thailand | 99.9 /100 | #69 | Exceptional 8.3% |
| Norwegians | 99.9 /100 | #70 | Exceptional 8.3% |
| Immigrants | Australia | 99.8 /100 | #71 | Exceptional 8.3% |
| Immigrants | Nepal | 99.8 /100 | #72 | Exceptional 8.3% |
| Spanish Americans | 99.8 /100 | #73 | Exceptional 8.4% |
| Samoans | 99.7 /100 | #74 | Exceptional 8.4% |
| Immigrants | Sri Lanka | 99.7 /100 | #75 | Exceptional 8.4% |
| Immigrants | Moldova | 99.7 /100 | #76 | Exceptional 8.4% |
| Iraqis | 99.7 /100 | #77 | Exceptional 8.4% |
| Pakistanis | 99.6 /100 | #78 | Exceptional 8.4% |
| Mongolians | 99.6 /100 | #79 | Exceptional 8.4% |
| Immigrants | Belarus | 99.6 /100 | #80 | Exceptional 8.4% |
| Immigrants | Bolivia | 99.6 /100 | #81 | Exceptional 8.4% |
| Cypriots | 99.6 /100 | #82 | Exceptional 8.4% |
| Bulgarians | 99.5 /100 | #83 | Exceptional 8.4% |
Demographics Similar to Immigrants from Norway by Unemployment Among Women with Children Ages 6 to 17 years
In terms of unemployment among women with children ages 6 to 17 years, the demographic groups most similar to Immigrants from Norway are Immigrants from Serbia (8.6%, a difference of 0.040%), Chickasaw (8.6%, a difference of 0.070%), Swedish (8.6%, a difference of 0.080%), Immigrants from France (8.6%, a difference of 0.15%), and Immigrants from Romania (8.6%, a difference of 0.15%).
| Demographics | Rating | Rank | Unemployment Among Women with Children Ages 6 to 17 years |
| Malaysians | 98.5 /100 | #98 | Exceptional 8.6% |
| Immigrants | Lithuania | 98.4 /100 | #99 | Exceptional 8.6% |
| New Zealanders | 98.4 /100 | #100 | Exceptional 8.6% |
| Immigrants | Pakistan | 98.4 /100 | #101 | Exceptional 8.6% |
| Immigrants | South Africa | 98.3 /100 | #102 | Exceptional 8.6% |
| Scandinavians | 98.3 /100 | #103 | Exceptional 8.6% |
| Immigrants | France | 98.0 /100 | #104 | Exceptional 8.6% |
| Immigrants | Norway | 97.8 /100 | #105 | Exceptional 8.6% |
| Immigrants | Serbia | 97.7 /100 | #106 | Exceptional 8.6% |
| Chickasaw | 97.6 /100 | #107 | Exceptional 8.6% |
| Swedes | 97.6 /100 | #108 | Exceptional 8.6% |
| Immigrants | Romania | 97.5 /100 | #109 | Exceptional 8.6% |
| Latvians | 97.4 /100 | #110 | Exceptional 8.6% |
| Immigrants | Ukraine | 97.4 /100 | #111 | Exceptional 8.6% |
| Romanians | 97.1 /100 | #112 | Exceptional 8.6% |