Immigrants from Micronesia vs Norwegian Unemployment Among Seniors over 75 years
COMPARE
Immigrants from Micronesia
Norwegian
Unemployment Among Seniors over 75 years
Unemployment Among Seniors over 75 years Comparison
Immigrants from Micronesia
Norwegians
8.8%
UNEMPLOYMENT AMONG SENIORS OVER 75 YEARS
37.2/ 100
METRIC RATING
184th/ 347
METRIC RANK
9.8%
UNEMPLOYMENT AMONG SENIORS OVER 75 YEARS
0.0/ 100
METRIC RATING
293rd/ 347
METRIC RANK
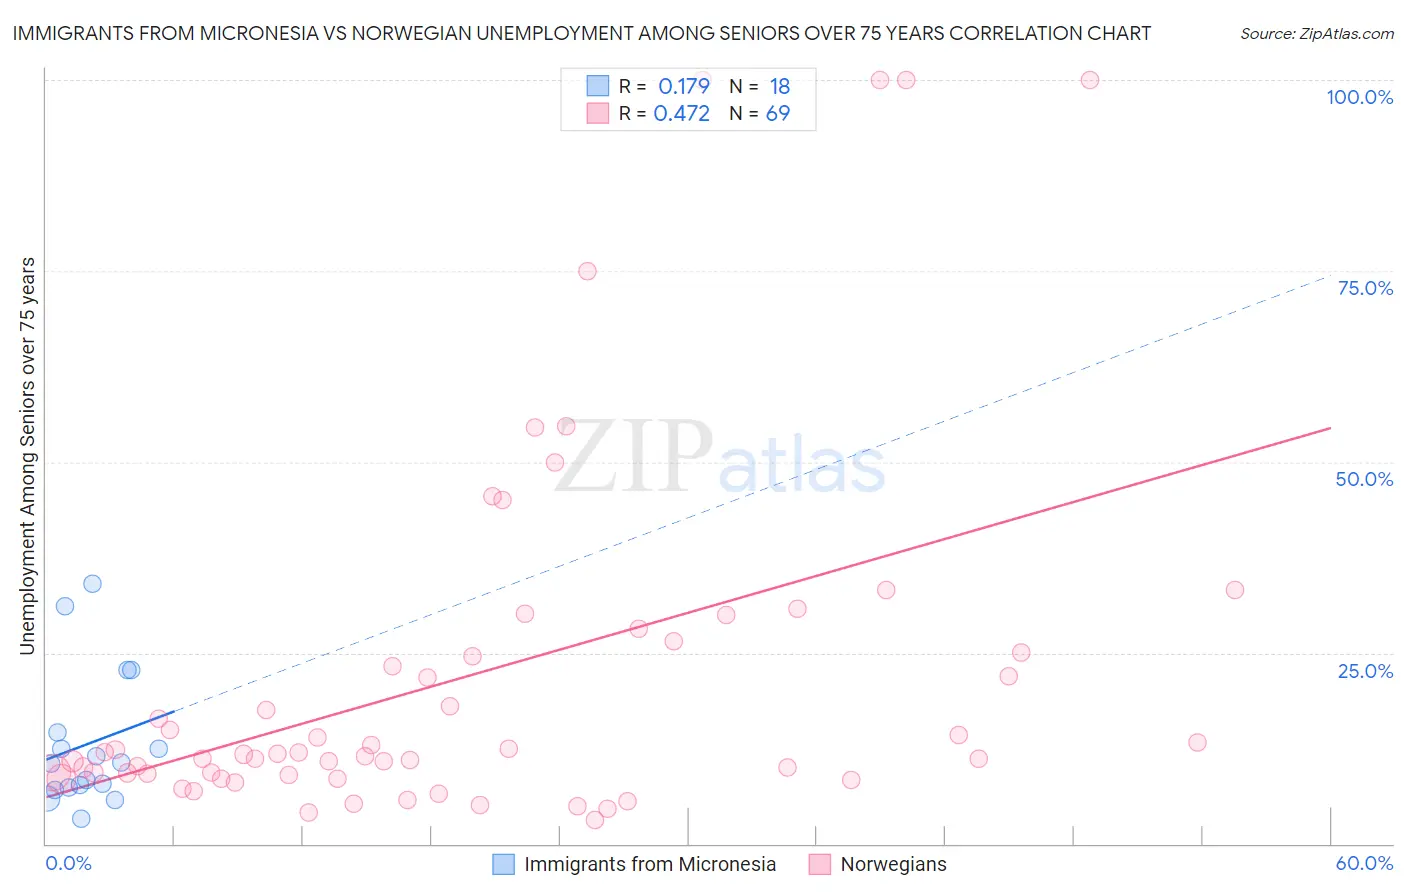
Immigrants from Micronesia vs Norwegian Unemployment Among Seniors over 75 years Correlation Chart
The statistical analysis conducted on geographies consisting of 48,327,887 people shows a poor positive correlation between the proportion of Immigrants from Micronesia and unemployment rate among seniors over the age of 75 in the United States with a correlation coefficient (R) of 0.179 and weighted average of 8.8%. Similarly, the statistical analysis conducted on geographies consisting of 229,000,677 people shows a moderate positive correlation between the proportion of Norwegians and unemployment rate among seniors over the age of 75 in the United States with a correlation coefficient (R) of 0.472 and weighted average of 9.8%, a difference of 11.2%.
Unemployment Among Seniors over 75 years Correlation Summary
| Measurement | Immigrants from Micronesia | Norwegian |
| Minimum | 3.3% | 3.1% |
| Maximum | 34.1% | 100.0% |
| Range | 30.8% | 96.9% |
| Mean | 13.1% | 22.1% |
| Median | 10.5% | 11.7% |
| Interquartile 25% (IQ1) | 7.4% | 9.1% |
| Interquartile 75% (IQ3) | 14.6% | 25.8% |
| Interquartile Range (IQR) | 7.2% | 16.7% |
| Standard Deviation (Sample) | 8.8% | 24.0% |
| Standard Deviation (Population) | 8.6% | 23.8% |
Similar Demographics by Unemployment Among Seniors over 75 years
Demographics Similar to Immigrants from Micronesia by Unemployment Among Seniors over 75 years
In terms of unemployment among seniors over 75 years, the demographic groups most similar to Immigrants from Micronesia are Choctaw (8.8%, a difference of 0.0%), Immigrants from Afghanistan (8.8%, a difference of 0.060%), Immigrants from Ethiopia (8.8%, a difference of 0.060%), Immigrants from Europe (8.8%, a difference of 0.11%), and Guatemalan (8.8%, a difference of 0.13%).
| Demographics | Rating | Rank | Unemployment Among Seniors over 75 years |
| Central Americans | 43.3 /100 | #177 | Average 8.8% |
| West Indians | 41.9 /100 | #178 | Average 8.8% |
| Immigrants | Italy | 41.7 /100 | #179 | Average 8.8% |
| Immigrants | Somalia | 41.7 /100 | #180 | Average 8.8% |
| Immigrants | Thailand | 40.2 /100 | #181 | Average 8.8% |
| Guatemalans | 39.5 /100 | #182 | Fair 8.8% |
| Immigrants | Afghanistan | 38.2 /100 | #183 | Fair 8.8% |
| Immigrants | Micronesia | 37.2 /100 | #184 | Fair 8.8% |
| Choctaw | 37.1 /100 | #185 | Fair 8.8% |
| Immigrants | Ethiopia | 36.2 /100 | #186 | Fair 8.8% |
| Immigrants | Europe | 35.2 /100 | #187 | Fair 8.8% |
| Immigrants | Eastern Europe | 34.7 /100 | #188 | Fair 8.8% |
| Immigrants | Haiti | 34.7 /100 | #189 | Fair 8.8% |
| Mexican American Indians | 34.7 /100 | #190 | Fair 8.8% |
| Estonians | 33.3 /100 | #191 | Fair 8.8% |
Demographics Similar to Norwegians by Unemployment Among Seniors over 75 years
In terms of unemployment among seniors over 75 years, the demographic groups most similar to Norwegians are Immigrants from Dominica (9.8%, a difference of 0.060%), Immigrants from Western Africa (9.8%, a difference of 0.17%), Nonimmigrants (9.8%, a difference of 0.42%), Scandinavian (9.7%, a difference of 0.46%), and Immigrants from St. Vincent and the Grenadines (9.8%, a difference of 0.47%).
| Demographics | Rating | Rank | Unemployment Among Seniors over 75 years |
| Nigerians | 0.0 /100 | #286 | Tragic 9.7% |
| Danes | 0.0 /100 | #287 | Tragic 9.7% |
| Canadians | 0.0 /100 | #288 | Tragic 9.7% |
| Czechs | 0.0 /100 | #289 | Tragic 9.7% |
| Sioux | 0.0 /100 | #290 | Tragic 9.7% |
| Scandinavians | 0.0 /100 | #291 | Tragic 9.7% |
| Immigrants | Western Africa | 0.0 /100 | #292 | Tragic 9.8% |
| Norwegians | 0.0 /100 | #293 | Tragic 9.8% |
| Immigrants | Dominica | 0.0 /100 | #294 | Tragic 9.8% |
| Immigrants | Nonimmigrants | 0.0 /100 | #295 | Tragic 9.8% |
| Immigrants | St. Vincent and the Grenadines | 0.0 /100 | #296 | Tragic 9.8% |
| Cherokee | 0.0 /100 | #297 | Tragic 9.8% |
| Lithuanians | 0.0 /100 | #298 | Tragic 9.9% |
| Belgians | 0.0 /100 | #299 | Tragic 9.9% |
| Iraqis | 0.0 /100 | #300 | Tragic 9.9% |