Immigrants from Mexico vs Immigrants from Singapore Unemployment Among Ages 60 to 64 years

COMPARE

Immigrants from Mexico
Race
Ancestry
AfghanAfricanAlaska NativeAlaskan AthabascanAlbanianAleutAlsatianAmericanApacheArabArapahoArgentineanArmenianAssyrian/Chaldean/SyriacAustralianAustrianBahamianBangladeshiBarbadianBasqueBelgianBelizeanBermudanBhutaneseBlackfeetBolivianBrazilianBritishBritish West IndianBulgarianBurmeseCajunCambodianCanadianCape VerdeanCarpatho RusynCelticCentral AmericanCentral American IndianCherokeeCheyenneChickasawChileanChineseChippewaChoctawColombianColvilleComancheCosta RicanCreeCreekCroatianCrowCubanCypriotCzechCzechoslovakianDanishDelawareDominicanDutchDutch West IndianEastern EuropeanEcuadorianEgyptianEnglishEstonianEthiopianEuropeanFijianFilipinoFinnishFrenchFrench American IndianFrench CanadianGermanGerman RussianGhanaianGreekGuamanian/ChamorroGuatemalanGuyaneseHaitianHmongHonduranHopiHoumaHungarianIcelanderIndian (Asian)IndonesianInupiatIranianIraqiIrishIroquoisIsraeliItalianJamaicanJapaneseJordanianKenyanKiowaKoreanLaotianLatvianLebaneseLiberianLithuanianLumbeeLuxembourgerMacedonianMalaysianMalteseMarshalleseMenomineeMexicanMexican American IndianMongolianMoroccanNative HawaiianNavajoNepaleseNew ZealanderNicaraguanNigerianNorthern EuropeanNorwegianOkinawanOsageOttawaPaiutePakistaniPalestinianPanamanianParaguayanPennsylvania GermanPeruvianPimaPolishPortuguesePotawatomiPuebloPuerto RicanPuget Sound SalishRomanianRussianSalvadoranSamoanScandinavianScotch-IrishScottishSeminoleSenegaleseSerbianShoshoneSierra LeoneanSiouxSlavicSlovakSloveneSomaliSouth AfricanSouth AmericanSouth American IndianSoviet UnionSpaniardSpanishSpanish AmericanSpanish American IndianSri LankanSubsaharan AfricanSudaneseSwedishSwissSyrianTaiwaneseThaiTlingit-HaidaTohono O'OdhamTonganTrinidadian and TobagonianTsimshianTurkishU.S. Virgin IslanderUgandanUkrainianUruguayanUteVenezuelanVietnameseWelshWest IndianYakamaYaquiYugoslavianYumanYup'ikZimbabwean
Immigration
NonimmigrantsImmigrantsAfghanistanAfricaAlbaniaArgentinaArmeniaAsiaAustraliaAustriaBahamasBangladeshBarbadosBelarusBelgiumBelizeBoliviaBosnia and HerzegovinaBrazilBulgariaBurma/MyanmarCabo VerdeCambodiaCameroonCanadaCaribbeanCentral AmericaChileChinaColombiaCongoCosta RicaCroatiaCubaCzechoslovakiaDenmarkDominicaDominican RepublicEastern AfricaEastern AsiaEastern EuropeEcuadorEgyptEl SalvadorEnglandEritreaEthiopiaEuropeFijiFranceGermanyGhanaGreeceGrenadaGuatemalaGuyanaHaitiHondurasHong KongHungaryIndiaIndonesiaIranIraqIrelandIsraelItalyJamaicaJapanJordanKazakhstanKenyaKoreaKuwaitLaosLatin AmericaLatviaLebanonLiberiaLithuaniaMalaysiaMexicoMicronesiaMiddle AfricaMoldovaMoroccoNepalNetherlandsNicaraguaNigeriaNorth AmericaNorth MacedoniaNorthern AfricaNorthern EuropeNorwayOceaniaPakistanPanamaPeruPhilippinesPolandPortugalRomaniaRussiaSaudi ArabiaScotlandSenegalSerbiaSierra LeoneSomaliaSouth AfricaSouth AmericaSouth Central AsiaSouth Eastern AsiaSouthern EuropeSpainSri LankaSt. Vincent and the GrenadinesSudanSwedenSwitzerlandSyriaTaiwanThailandTrinidad and TobagoTurkeyUgandaUkraineUruguayUzbekistanVenezuelaVietnamWest IndiesWestern AfricaWestern AsiaWestern EuropeYemenZaireZimbabweAzores
Immigrants from Singapore
Race
Ancestry
AfghanAfricanAlaska NativeAlaskan AthabascanAlbanianAleutAlsatianAmericanApacheArabArapahoArgentineanArmenianAssyrian/Chaldean/SyriacAustralianAustrianBahamianBangladeshiBarbadianBasqueBelgianBelizeanBermudanBhutaneseBlackfeetBolivianBrazilianBritishBritish West IndianBulgarianBurmeseCajunCambodianCanadianCape VerdeanCarpatho RusynCelticCentral AmericanCentral American IndianCherokeeCheyenneChickasawChileanChineseChippewaChoctawColombianColvilleComancheCosta RicanCreeCreekCroatianCrowCubanCypriotCzechCzechoslovakianDanishDelawareDominicanDutchDutch West IndianEastern EuropeanEcuadorianEgyptianEnglishEstonianEthiopianEuropeanFijianFilipinoFinnishFrenchFrench American IndianFrench CanadianGermanGerman RussianGhanaianGreekGuamanian/ChamorroGuatemalanGuyaneseHaitianHmongHonduranHopiHoumaHungarianIcelanderIndian (Asian)IndonesianInupiatIranianIraqiIrishIroquoisIsraeliItalianJamaicanJapaneseJordanianKenyanKiowaKoreanLaotianLatvianLebaneseLiberianLithuanianLumbeeLuxembourgerMacedonianMalaysianMalteseMarshalleseMenomineeMexicanMexican American IndianMongolianMoroccanNative HawaiianNavajoNepaleseNew ZealanderNicaraguanNigerianNorthern EuropeanNorwegianOkinawanOsageOttawaPaiutePakistaniPalestinianPanamanianParaguayanPennsylvania GermanPeruvianPimaPolishPortuguesePotawatomiPuebloPuerto RicanPuget Sound SalishRomanianRussianSalvadoranSamoanScandinavianScotch-IrishScottishSeminoleSenegaleseSerbianShoshoneSierra LeoneanSiouxSlavicSlovakSloveneSomaliSouth AfricanSouth AmericanSouth American IndianSoviet UnionSpaniardSpanishSpanish AmericanSpanish American IndianSri LankanSubsaharan AfricanSudaneseSwedishSwissSyrianTaiwaneseThaiTlingit-HaidaTohono O'OdhamTonganTrinidadian and TobagonianTsimshianTurkishU.S. Virgin IslanderUgandanUkrainianUruguayanUteVenezuelanVietnameseWelshWest IndianYakamaYaquiYugoslavianYumanYup'ikZimbabwean
Immigration
NonimmigrantsImmigrantsAfghanistanAfricaAlbaniaArgentinaArmeniaAsiaAustraliaAustriaBahamasBangladeshBarbadosBelarusBelgiumBelizeBoliviaBosnia and HerzegovinaBrazilBulgariaBurma/MyanmarCabo VerdeCambodiaCameroonCanadaCaribbeanCentral AmericaChileChinaColombiaCongoCosta RicaCroatiaCubaCzechoslovakiaDenmarkDominicaDominican RepublicEastern AfricaEastern AsiaEastern EuropeEcuadorEgyptEl SalvadorEnglandEritreaEthiopiaEuropeFijiFranceGermanyGhanaGreeceGrenadaGuatemalaGuyanaHaitiHondurasHong KongHungaryIndiaIndonesiaIranIraqIrelandIsraelItalyJamaicaJapanJordanKazakhstanKenyaKoreaKuwaitLaosLatin AmericaLatviaLebanonLiberiaLithuaniaMalaysiaMicronesiaMiddle AfricaMoldovaMoroccoNepalNetherlandsNicaraguaNigeriaNorth AmericaNorth MacedoniaNorthern AfricaNorthern EuropeNorwayOceaniaPakistanPanamaPeruPhilippinesPolandPortugalRomaniaRussiaSaudi ArabiaScotlandSenegalSerbiaSierra LeoneSingaporeSomaliaSouth AfricaSouth AmericaSouth Central AsiaSouth Eastern AsiaSouthern EuropeSpainSri LankaSt. Vincent and the GrenadinesSudanSwedenSwitzerlandSyriaTaiwanThailandTrinidad and TobagoTurkeyUgandaUkraineUruguayUzbekistanVenezuelaVietnamWest IndiesWestern AfricaWestern AsiaWestern EuropeYemenZaireZimbabweAzores
Unemployment Among Ages 60 to 64 years
Income
Poverty
Unemployment
Labor Participation
Family Structure
Vehicle Availability
Education Level
Disability

Unemployment Among Ages 60 to 64 years Comparison

Immigrants from Mexico

Immigrants from Singapore

Tragic
Poor
5.4%
UNEMPLOYMENT AMONG AGES 60 TO 64 YEARS
0.0/ 100
METRIC RATING
304th/ 347
METRIC RANK
4.9%
UNEMPLOYMENT AMONG AGES 60 TO 64 YEARS
12.0/ 100
METRIC RATING
218th/ 347
METRIC RANK

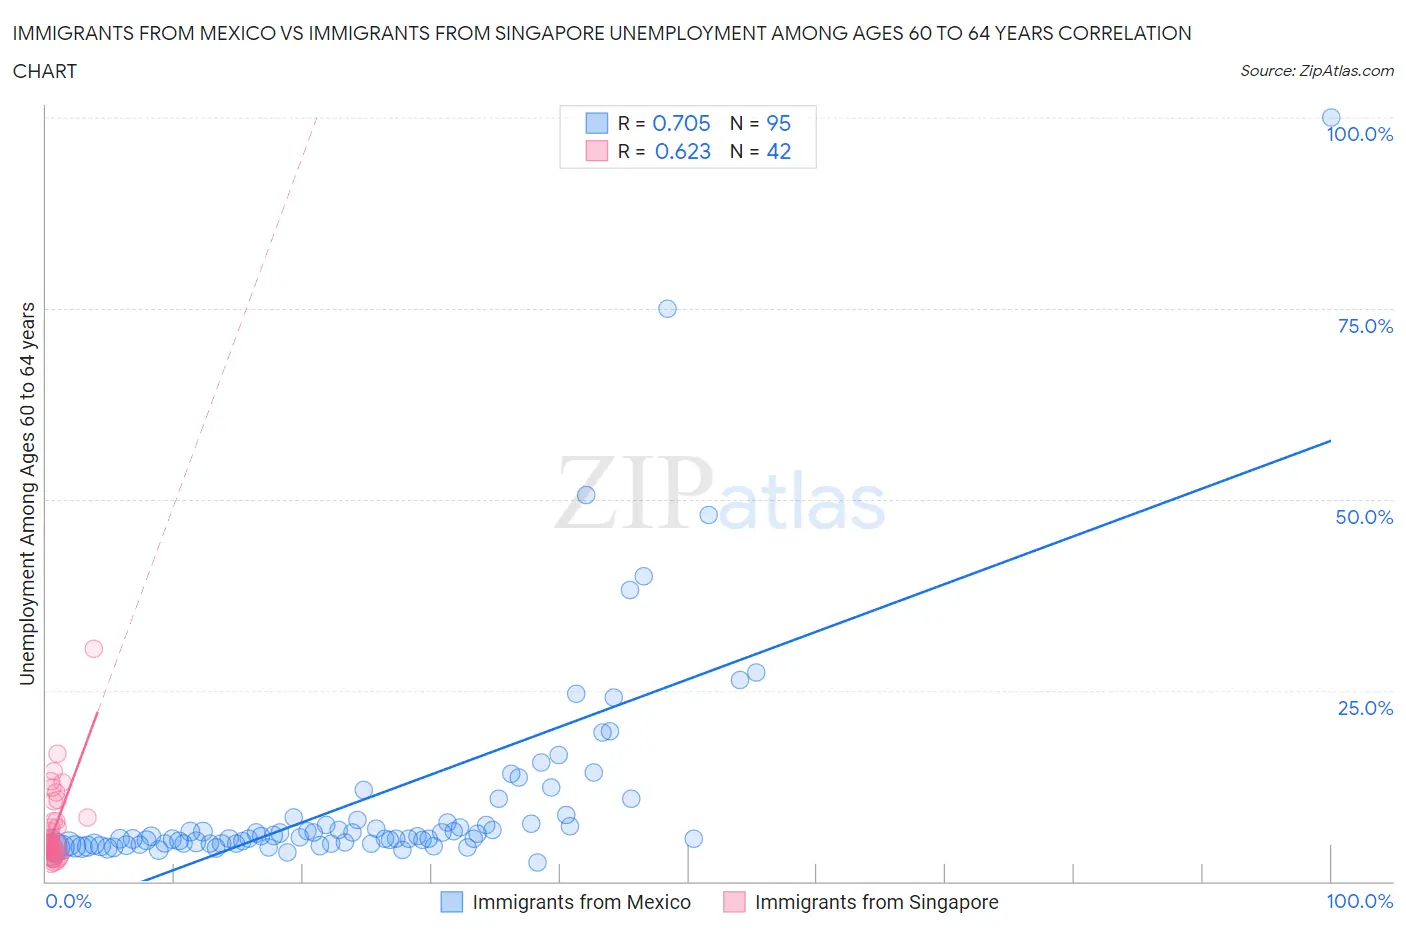
Immigrants from Mexico vs Immigrants from Singapore Unemployment Among Ages 60 to 64 years Correlation Chart

The statistical analysis conducted on geographies consisting of 436,043,576 people shows a strong positive correlation between the proportion of Immigrants from Mexico and unemployment rate among population between the ages 60 and 64 in the United States with a correlation coefficient (R) of 0.705 and weighted average of 5.4%. Similarly, the statistical analysis conducted on geographies consisting of 132,440,253 people shows a significant positive correlation between the proportion of Immigrants from Singapore and unemployment rate among population between the ages 60 and 64 in the United States with a correlation coefficient (R) of 0.623 and weighted average of 4.9%, a difference of 9.1%.
Immigrants from Mexico vs Immigrants from Singapore Unemployment Among Ages 60 to 64 years

Unemployment Among Ages 60 to 64 years Correlation Summary

MeasurementImmigrants from MexicoImmigrants from Singapore
Minimum2.5%2.3%
Maximum100.0%30.4%
Range97.5%28.1%
Mean10.8%6.8%
Median5.8%4.8%
Interquartile 25% (IQ1)4.9%3.9%
Interquartile 75% (IQ3)8.0%7.8%
Interquartile Range (IQR)3.0%3.9%
Standard Deviation (Sample)14.5%5.2%
Standard Deviation (Population)14.5%5.1%

Similar Demographics by Unemployment Among Ages 60 to 64 years

Demographics Similar to Immigrants from Mexico by Unemployment Among Ages 60 to 64 years

In terms of unemployment among ages 60 to 64 years, the demographic groups most similar to Immigrants from Mexico are Cypriot (5.4%, a difference of 0.020%), Bahamian (5.4%, a difference of 0.050%), Immigrants from Dominica (5.4%, a difference of 0.090%), Barbadian (5.4%, a difference of 0.14%), and Immigrants from Guyana (5.4%, a difference of 0.26%).
DemographicsRating | RankUnemployment Among Ages 60 to 64 years
Osage
0.0
/100
|
#297
Tragic
5.4%
Immigrants | Central America
0.0
/100
|
#298
Tragic
5.4%
Immigrants | El Salvador
0.0
/100
|
#299
Tragic
5.4%
Immigrants | Barbados
0.0
/100
|
#300
Tragic
5.4%
Immigrants | Jamaica
0.0
/100
|
#301
Tragic
5.4%
Barbadians
0.0
/100
|
#302
Tragic
5.4%
Bahamians
0.0
/100
|
#303
Tragic
5.4%
Immigrants | Mexico
0.0
/100
|
#304
Tragic
5.4%
Cypriots
0.0
/100
|
#305
Tragic
5.4%
Immigrants | Dominica
0.0
/100
|
#306
Tragic
5.4%
Immigrants | Guyana
0.0
/100
|
#307
Tragic
5.4%
Spanish American Indians
0.0
/100
|
#308
Tragic
5.4%
Soviet Union
0.0
/100
|
#309
Tragic
5.4%
British West Indians
0.0
/100
|
#310
Tragic
5.5%
U.S. Virgin Islanders
0.0
/100
|
#311
Tragic
5.5%

Demographics Similar to Immigrants from Singapore by Unemployment Among Ages 60 to 64 years

In terms of unemployment among ages 60 to 64 years, the demographic groups most similar to Immigrants from Singapore are Korean (4.9%, a difference of 0.010%), Cajun (4.9%, a difference of 0.020%), Immigrants from Brazil (4.9%, a difference of 0.030%), Ottawa (4.9%, a difference of 0.040%), and Immigrants from South Eastern Asia (4.9%, a difference of 0.080%).
DemographicsRating | RankUnemployment Among Ages 60 to 64 years
Blackfeet
15.7
/100
|
#211
Poor
4.9%
Moroccans
15.0
/100
|
#212
Poor
4.9%
Eastern Europeans
14.3
/100
|
#213
Poor
4.9%
Immigrants | Russia
13.7
/100
|
#214
Poor
4.9%
Immigrants | South Eastern Asia
13.1
/100
|
#215
Poor
4.9%
Cajuns
12.3
/100
|
#216
Poor
4.9%
Koreans
12.2
/100
|
#217
Poor
4.9%
Immigrants | Singapore
12.0
/100
|
#218
Poor
4.9%
Immigrants | Brazil
11.7
/100
|
#219
Poor
4.9%
Ottawa
11.6
/100
|
#220
Poor
4.9%
Ugandans
10.5
/100
|
#221
Poor
4.9%
Brazilians
10.1
/100
|
#222
Poor
5.0%
Crow
9.7
/100
|
#223
Tragic
5.0%
Immigrants | Cameroon
8.5
/100
|
#224
Tragic
5.0%
Immigrants | Ireland
7.2
/100
|
#225
Tragic
5.0%