Greek vs Immigrants from Singapore Unemployment Among Ages 60 to 64 years
COMPARE
Greek
Immigrants from Singapore
Unemployment Among Ages 60 to 64 years
Unemployment Among Ages 60 to 64 years Comparison
Greeks
Immigrants from Singapore
4.7%
UNEMPLOYMENT AMONG AGES 60 TO 64 YEARS
97.5/ 100
METRIC RATING
107th/ 347
METRIC RANK
4.9%
UNEMPLOYMENT AMONG AGES 60 TO 64 YEARS
12.0/ 100
METRIC RATING
218th/ 347
METRIC RANK
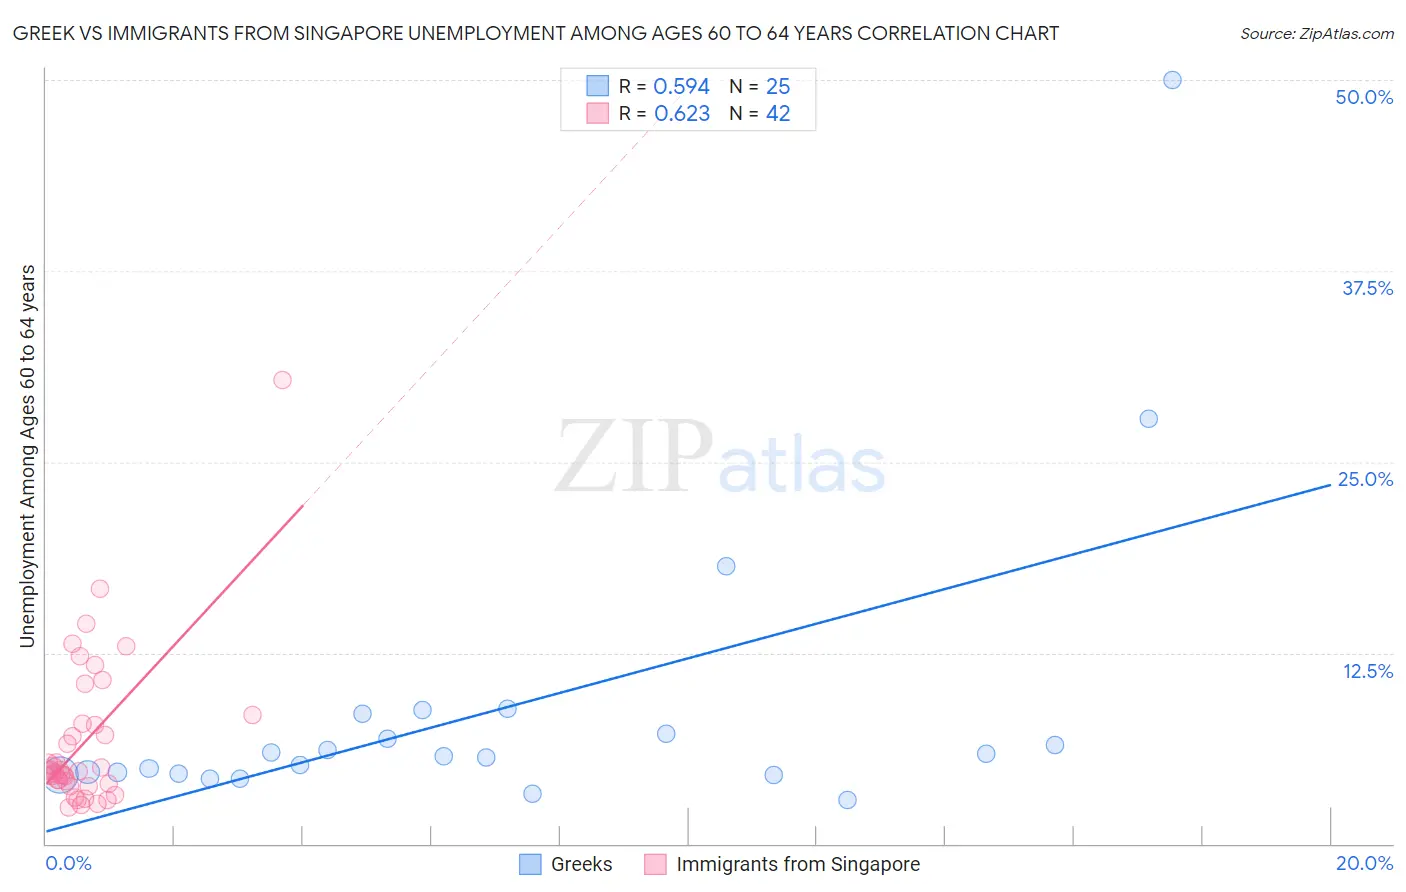
Greek vs Immigrants from Singapore Unemployment Among Ages 60 to 64 years Correlation Chart
The statistical analysis conducted on geographies consisting of 420,815,200 people shows a substantial positive correlation between the proportion of Greeks and unemployment rate among population between the ages 60 and 64 in the United States with a correlation coefficient (R) of 0.594 and weighted average of 4.7%. Similarly, the statistical analysis conducted on geographies consisting of 132,440,253 people shows a significant positive correlation between the proportion of Immigrants from Singapore and unemployment rate among population between the ages 60 and 64 in the United States with a correlation coefficient (R) of 0.623 and weighted average of 4.9%, a difference of 5.2%.
Unemployment Among Ages 60 to 64 years Correlation Summary
| Measurement | Greek | Immigrants from Singapore |
| Minimum | 2.9% | 2.3% |
| Maximum | 50.0% | 30.4% |
| Range | 47.1% | 28.1% |
| Mean | 8.8% | 6.8% |
| Median | 5.7% | 4.8% |
| Interquartile 25% (IQ1) | 4.6% | 3.9% |
| Interquartile 75% (IQ3) | 7.9% | 7.8% |
| Interquartile Range (IQR) | 3.3% | 3.9% |
| Standard Deviation (Sample) | 10.0% | 5.2% |
| Standard Deviation (Population) | 9.8% | 5.1% |
Similar Demographics by Unemployment Among Ages 60 to 64 years
Demographics Similar to Greeks by Unemployment Among Ages 60 to 64 years
In terms of unemployment among ages 60 to 64 years, the demographic groups most similar to Greeks are Immigrants from North America (4.7%, a difference of 0.010%), Canadian (4.7%, a difference of 0.040%), Immigrants from Japan (4.7%, a difference of 0.040%), Immigrants from Netherlands (4.7%, a difference of 0.040%), and Paraguayan (4.7%, a difference of 0.070%).
| Demographics | Rating | Rank | Unemployment Among Ages 60 to 64 years |
| Portuguese | 97.9 /100 | #100 | Exceptional 4.7% |
| Malaysians | 97.9 /100 | #101 | Exceptional 4.7% |
| Immigrants | Canada | 97.8 /100 | #102 | Exceptional 4.7% |
| Whites/Caucasians | 97.8 /100 | #103 | Exceptional 4.7% |
| Paraguayans | 97.7 /100 | #104 | Exceptional 4.7% |
| Canadians | 97.7 /100 | #105 | Exceptional 4.7% |
| Immigrants | North America | 97.6 /100 | #106 | Exceptional 4.7% |
| Greeks | 97.5 /100 | #107 | Exceptional 4.7% |
| Immigrants | Japan | 97.4 /100 | #108 | Exceptional 4.7% |
| Immigrants | Netherlands | 97.4 /100 | #109 | Exceptional 4.7% |
| Ethiopians | 97.2 /100 | #110 | Exceptional 4.7% |
| French | 97.1 /100 | #111 | Exceptional 4.7% |
| Syrians | 97.0 /100 | #112 | Exceptional 4.7% |
| Bulgarians | 96.6 /100 | #113 | Exceptional 4.7% |
| Maltese | 96.5 /100 | #114 | Exceptional 4.7% |
Demographics Similar to Immigrants from Singapore by Unemployment Among Ages 60 to 64 years
In terms of unemployment among ages 60 to 64 years, the demographic groups most similar to Immigrants from Singapore are Korean (4.9%, a difference of 0.010%), Cajun (4.9%, a difference of 0.020%), Immigrants from Brazil (4.9%, a difference of 0.030%), Ottawa (4.9%, a difference of 0.040%), and Immigrants from South Eastern Asia (4.9%, a difference of 0.080%).
| Demographics | Rating | Rank | Unemployment Among Ages 60 to 64 years |
| Blackfeet | 15.7 /100 | #211 | Poor 4.9% |
| Moroccans | 15.0 /100 | #212 | Poor 4.9% |
| Eastern Europeans | 14.3 /100 | #213 | Poor 4.9% |
| Immigrants | Russia | 13.7 /100 | #214 | Poor 4.9% |
| Immigrants | South Eastern Asia | 13.1 /100 | #215 | Poor 4.9% |
| Cajuns | 12.3 /100 | #216 | Poor 4.9% |
| Koreans | 12.2 /100 | #217 | Poor 4.9% |
| Immigrants | Singapore | 12.0 /100 | #218 | Poor 4.9% |
| Immigrants | Brazil | 11.7 /100 | #219 | Poor 4.9% |
| Ottawa | 11.6 /100 | #220 | Poor 4.9% |
| Ugandans | 10.5 /100 | #221 | Poor 4.9% |
| Brazilians | 10.1 /100 | #222 | Poor 5.0% |
| Crow | 9.7 /100 | #223 | Tragic 5.0% |
| Immigrants | Cameroon | 8.5 /100 | #224 | Tragic 5.0% |
| Immigrants | Ireland | 7.2 /100 | #225 | Tragic 5.0% |