Immigrants from Malaysia vs Immigrants from North America Unemployment Among Ages 55 to 59 years
COMPARE
Immigrants from Malaysia
Immigrants from North America
Unemployment Among Ages 55 to 59 years
Unemployment Among Ages 55 to 59 years Comparison
Immigrants from Malaysia
Immigrants from North America
4.7%
UNEMPLOYMENT AMONG AGES 55 TO 59 YEARS
87.9/ 100
METRIC RATING
125th/ 347
METRIC RANK
4.7%
UNEMPLOYMENT AMONG AGES 55 TO 59 YEARS
93.9/ 100
METRIC RATING
105th/ 347
METRIC RANK
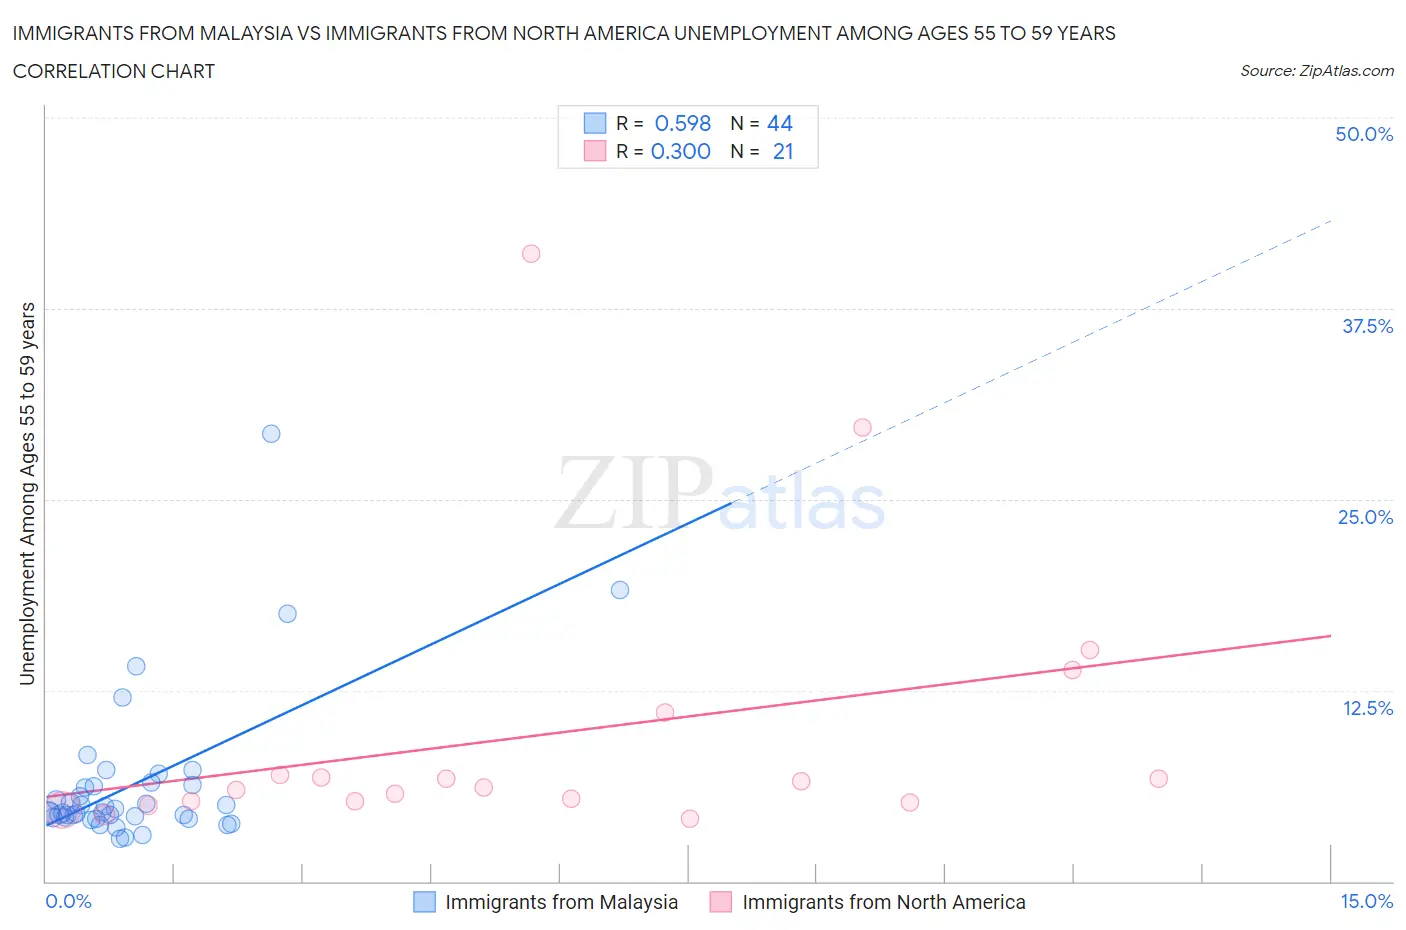
Immigrants from Malaysia vs Immigrants from North America Unemployment Among Ages 55 to 59 years Correlation Chart
The statistical analysis conducted on geographies consisting of 191,474,350 people shows a substantial positive correlation between the proportion of Immigrants from Malaysia and unemployment rate among population between the ages 55 and 59 in the United States with a correlation coefficient (R) of 0.598 and weighted average of 4.7%. Similarly, the statistical analysis conducted on geographies consisting of 420,202,803 people shows a mild positive correlation between the proportion of Immigrants from North America and unemployment rate among population between the ages 55 and 59 in the United States with a correlation coefficient (R) of 0.300 and weighted average of 4.7%, a difference of 0.78%.
Unemployment Among Ages 55 to 59 years Correlation Summary
| Measurement | Immigrants from Malaysia | Immigrants from North America |
| Minimum | 2.8% | 4.1% |
| Maximum | 29.3% | 41.1% |
| Range | 26.5% | 37.0% |
| Mean | 6.4% | 9.6% |
| Median | 4.5% | 6.1% |
| Interquartile 25% (IQ1) | 4.2% | 5.2% |
| Interquartile 75% (IQ3) | 6.2% | 9.0% |
| Interquartile Range (IQR) | 2.1% | 3.8% |
| Standard Deviation (Sample) | 5.0% | 9.2% |
| Standard Deviation (Population) | 4.9% | 9.0% |
Demographics Similar to Immigrants from Malaysia and Immigrants from North America by Unemployment Among Ages 55 to 59 years
In terms of unemployment among ages 55 to 59 years, the demographic groups most similar to Immigrants from Malaysia are Lithuanian (4.7%, a difference of 0.10%), Immigrants from Japan (4.7%, a difference of 0.16%), Immigrants from Afghanistan (4.7%, a difference of 0.17%), Pakistani (4.7%, a difference of 0.19%), and Immigrants from South Africa (4.7%, a difference of 0.21%). Similarly, the demographic groups most similar to Immigrants from North America are Immigrants from Laos (4.7%, a difference of 0.010%), Immigrants from Egypt (4.7%, a difference of 0.070%), French (4.7%, a difference of 0.11%), Chilean (4.7%, a difference of 0.12%), and Egyptian (4.7%, a difference of 0.17%).
| Demographics | Rating | Rank | Unemployment Among Ages 55 to 59 years |
| Immigrants | North America | 93.9 /100 | #105 | Exceptional 4.7% |
| Immigrants | Laos | 93.9 /100 | #106 | Exceptional 4.7% |
| Immigrants | Egypt | 93.5 /100 | #107 | Exceptional 4.7% |
| French | 93.3 /100 | #108 | Exceptional 4.7% |
| Chileans | 93.2 /100 | #109 | Exceptional 4.7% |
| Egyptians | 92.9 /100 | #110 | Exceptional 4.7% |
| Austrians | 92.4 /100 | #111 | Exceptional 4.7% |
| Afghans | 92.1 /100 | #112 | Exceptional 4.7% |
| Immigrants | Spain | 91.4 /100 | #113 | Exceptional 4.7% |
| Bangladeshis | 91.3 /100 | #114 | Exceptional 4.7% |
| South American Indians | 90.9 /100 | #115 | Exceptional 4.7% |
| Turks | 90.9 /100 | #116 | Exceptional 4.7% |
| Asians | 90.8 /100 | #117 | Exceptional 4.7% |
| Immigrants | Chile | 90.7 /100 | #118 | Exceptional 4.7% |
| Whites/Caucasians | 90.7 /100 | #119 | Exceptional 4.7% |
| Immigrants | South Africa | 89.9 /100 | #120 | Excellent 4.7% |
| Pakistanis | 89.7 /100 | #121 | Excellent 4.7% |
| Immigrants | Afghanistan | 89.5 /100 | #122 | Excellent 4.7% |
| Immigrants | Japan | 89.4 /100 | #123 | Excellent 4.7% |
| Lithuanians | 88.8 /100 | #124 | Excellent 4.7% |
| Immigrants | Malaysia | 87.9 /100 | #125 | Excellent 4.7% |