Ghanaian vs Immigrants from North America Unemployment Among Ages 55 to 59 years
COMPARE
Ghanaian
Immigrants from North America
Unemployment Among Ages 55 to 59 years
Unemployment Among Ages 55 to 59 years Comparison
Ghanaians
Immigrants from North America
5.3%
UNEMPLOYMENT AMONG AGES 55 TO 59 YEARS
0.0/ 100
METRIC RATING
284th/ 347
METRIC RANK
4.7%
UNEMPLOYMENT AMONG AGES 55 TO 59 YEARS
93.9/ 100
METRIC RATING
105th/ 347
METRIC RANK
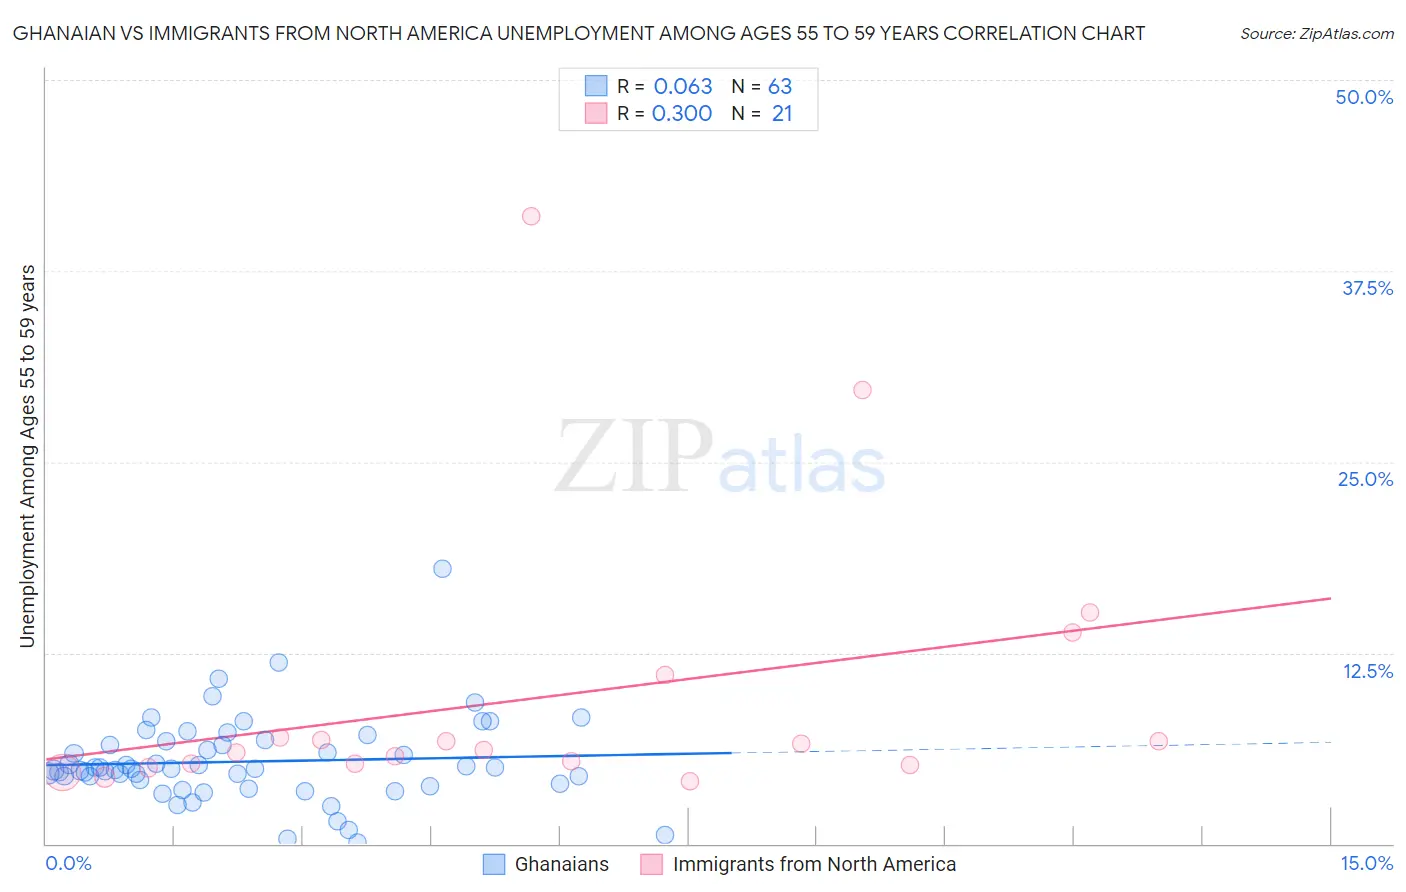
Ghanaian vs Immigrants from North America Unemployment Among Ages 55 to 59 years Correlation Chart
The statistical analysis conducted on geographies consisting of 184,325,244 people shows a slight positive correlation between the proportion of Ghanaians and unemployment rate among population between the ages 55 and 59 in the United States with a correlation coefficient (R) of 0.063 and weighted average of 5.3%. Similarly, the statistical analysis conducted on geographies consisting of 420,202,803 people shows a mild positive correlation between the proportion of Immigrants from North America and unemployment rate among population between the ages 55 and 59 in the United States with a correlation coefficient (R) of 0.300 and weighted average of 4.7%, a difference of 12.7%.
Unemployment Among Ages 55 to 59 years Correlation Summary
| Measurement | Ghanaian | Immigrants from North America |
| Minimum | 0.10% | 4.1% |
| Maximum | 18.0% | 41.1% |
| Range | 17.9% | 37.0% |
| Mean | 5.4% | 9.6% |
| Median | 4.9% | 6.1% |
| Interquartile 25% (IQ1) | 3.9% | 5.2% |
| Interquartile 75% (IQ3) | 6.7% | 9.0% |
| Interquartile Range (IQR) | 2.8% | 3.8% |
| Standard Deviation (Sample) | 2.8% | 9.2% |
| Standard Deviation (Population) | 2.8% | 9.0% |
Similar Demographics by Unemployment Among Ages 55 to 59 years
Demographics Similar to Ghanaians by Unemployment Among Ages 55 to 59 years
In terms of unemployment among ages 55 to 59 years, the demographic groups most similar to Ghanaians are Apache (5.3%, a difference of 0.040%), Immigrants from Trinidad and Tobago (5.3%, a difference of 0.080%), Armenian (5.3%, a difference of 0.10%), Immigrants from Ghana (5.3%, a difference of 0.22%), and Immigrants from Guatemala (5.3%, a difference of 0.24%).
| Demographics | Rating | Rank | Unemployment Among Ages 55 to 59 years |
| Immigrants | Latin America | 0.0 /100 | #277 | Tragic 5.2% |
| Immigrants | Barbados | 0.0 /100 | #278 | Tragic 5.2% |
| Alsatians | 0.0 /100 | #279 | Tragic 5.2% |
| Immigrants | Uzbekistan | 0.0 /100 | #280 | Tragic 5.3% |
| Guatemalans | 0.0 /100 | #281 | Tragic 5.3% |
| Immigrants | Trinidad and Tobago | 0.0 /100 | #282 | Tragic 5.3% |
| Apache | 0.0 /100 | #283 | Tragic 5.3% |
| Ghanaians | 0.0 /100 | #284 | Tragic 5.3% |
| Armenians | 0.0 /100 | #285 | Tragic 5.3% |
| Immigrants | Ghana | 0.0 /100 | #286 | Tragic 5.3% |
| Immigrants | Guatemala | 0.0 /100 | #287 | Tragic 5.3% |
| Immigrants | Israel | 0.0 /100 | #288 | Tragic 5.3% |
| Immigrants | Central America | 0.0 /100 | #289 | Tragic 5.3% |
| Sioux | 0.0 /100 | #290 | Tragic 5.3% |
| Trinidadians and Tobagonians | 0.0 /100 | #291 | Tragic 5.3% |
Demographics Similar to Immigrants from North America by Unemployment Among Ages 55 to 59 years
In terms of unemployment among ages 55 to 59 years, the demographic groups most similar to Immigrants from North America are Immigrants from Turkey (4.7%, a difference of 0.010%), Immigrants from Laos (4.7%, a difference of 0.010%), Canadian (4.7%, a difference of 0.030%), Immigrants from Oceania (4.7%, a difference of 0.030%), and Immigrants from Egypt (4.7%, a difference of 0.070%).
| Demographics | Rating | Rank | Unemployment Among Ages 55 to 59 years |
| Immigrants | Germany | 94.8 /100 | #98 | Exceptional 4.7% |
| Yugoslavians | 94.7 /100 | #99 | Exceptional 4.7% |
| Serbians | 94.4 /100 | #100 | Exceptional 4.7% |
| Celtics | 94.3 /100 | #101 | Exceptional 4.7% |
| Canadians | 94.1 /100 | #102 | Exceptional 4.7% |
| Immigrants | Oceania | 94.0 /100 | #103 | Exceptional 4.7% |
| Immigrants | Turkey | 93.9 /100 | #104 | Exceptional 4.7% |
| Immigrants | North America | 93.9 /100 | #105 | Exceptional 4.7% |
| Immigrants | Laos | 93.9 /100 | #106 | Exceptional 4.7% |
| Immigrants | Egypt | 93.5 /100 | #107 | Exceptional 4.7% |
| French | 93.3 /100 | #108 | Exceptional 4.7% |
| Chileans | 93.2 /100 | #109 | Exceptional 4.7% |
| Egyptians | 92.9 /100 | #110 | Exceptional 4.7% |
| Austrians | 92.4 /100 | #111 | Exceptional 4.7% |
| Afghans | 92.1 /100 | #112 | Exceptional 4.7% |