Immigrants from Lithuania vs Cajun Unemployment Among Ages 60 to 64 years
COMPARE
Immigrants from Lithuania
Cajun
Unemployment Among Ages 60 to 64 years
Unemployment Among Ages 60 to 64 years Comparison
Immigrants from Lithuania
Cajuns
4.8%
UNEMPLOYMENT AMONG AGES 60 TO 64 YEARS
86.7/ 100
METRIC RATING
138th/ 347
METRIC RANK
4.9%
UNEMPLOYMENT AMONG AGES 60 TO 64 YEARS
12.3/ 100
METRIC RATING
216th/ 347
METRIC RANK
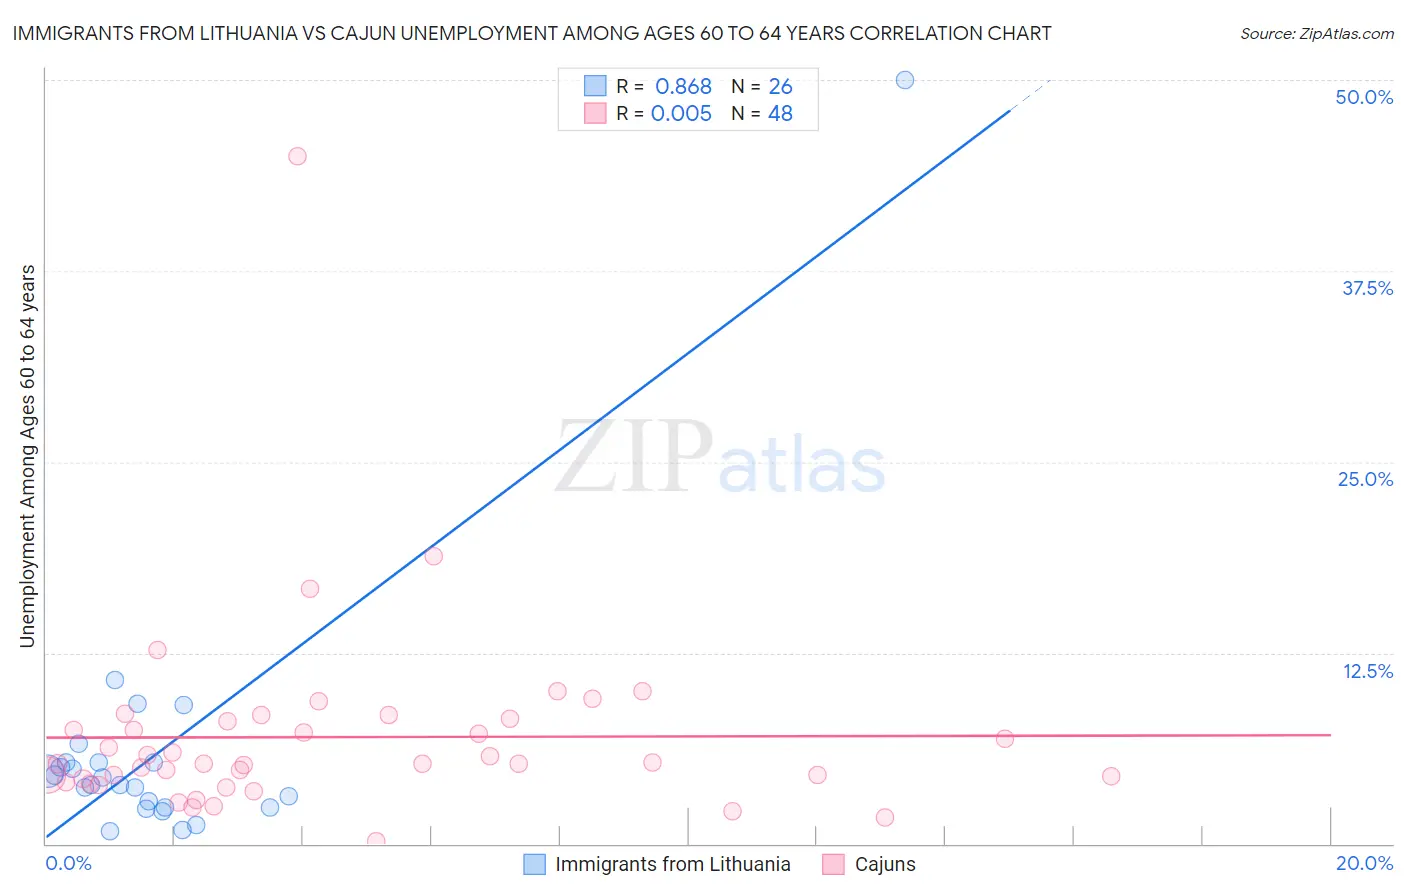
Immigrants from Lithuania vs Cajun Unemployment Among Ages 60 to 64 years Correlation Chart
The statistical analysis conducted on geographies consisting of 114,105,176 people shows a very strong positive correlation between the proportion of Immigrants from Lithuania and unemployment rate among population between the ages 60 and 64 in the United States with a correlation coefficient (R) of 0.868 and weighted average of 4.8%. Similarly, the statistical analysis conducted on geographies consisting of 139,908,047 people shows no correlation between the proportion of Cajuns and unemployment rate among population between the ages 60 and 64 in the United States with a correlation coefficient (R) of 0.005 and weighted average of 4.9%, a difference of 3.4%.
Unemployment Among Ages 60 to 64 years Correlation Summary
| Measurement | Immigrants from Lithuania | Cajun |
| Minimum | 0.80% | 0.20% |
| Maximum | 50.0% | 45.0% |
| Range | 49.2% | 44.8% |
| Mean | 6.1% | 7.0% |
| Median | 4.1% | 5.2% |
| Interquartile 25% (IQ1) | 2.4% | 4.1% |
| Interquartile 75% (IQ3) | 5.3% | 8.1% |
| Interquartile Range (IQR) | 2.9% | 4.0% |
| Standard Deviation (Sample) | 9.3% | 6.6% |
| Standard Deviation (Population) | 9.1% | 6.5% |
Similar Demographics by Unemployment Among Ages 60 to 64 years
Demographics Similar to Immigrants from Lithuania by Unemployment Among Ages 60 to 64 years
In terms of unemployment among ages 60 to 64 years, the demographic groups most similar to Immigrants from Lithuania are Immigrants from Africa (4.8%, a difference of 0.0%), Cambodian (4.8%, a difference of 0.020%), Pima (4.8%, a difference of 0.070%), French Canadian (4.8%, a difference of 0.080%), and Pennsylvania German (4.8%, a difference of 0.090%).
| Demographics | Rating | Rank | Unemployment Among Ages 60 to 64 years |
| Immigrants | Lebanon | 89.6 /100 | #131 | Excellent 4.8% |
| Lithuanians | 89.6 /100 | #132 | Excellent 4.8% |
| Yaqui | 89.5 /100 | #133 | Excellent 4.8% |
| Basques | 88.8 /100 | #134 | Excellent 4.8% |
| Pennsylvania Germans | 87.8 /100 | #135 | Excellent 4.8% |
| French Canadians | 87.6 /100 | #136 | Excellent 4.8% |
| Cambodians | 86.9 /100 | #137 | Excellent 4.8% |
| Immigrants | Lithuania | 86.7 /100 | #138 | Excellent 4.8% |
| Immigrants | Africa | 86.6 /100 | #139 | Excellent 4.8% |
| Pima | 85.8 /100 | #140 | Excellent 4.8% |
| Panamanians | 85.5 /100 | #141 | Excellent 4.8% |
| Immigrants | Ethiopia | 85.3 /100 | #142 | Excellent 4.8% |
| Italians | 85.0 /100 | #143 | Excellent 4.8% |
| Immigrants | Pakistan | 83.3 /100 | #144 | Excellent 4.8% |
| Burmese | 83.1 /100 | #145 | Excellent 4.8% |
Demographics Similar to Cajuns by Unemployment Among Ages 60 to 64 years
In terms of unemployment among ages 60 to 64 years, the demographic groups most similar to Cajuns are Korean (4.9%, a difference of 0.010%), Immigrants from Singapore (4.9%, a difference of 0.020%), Immigrants from Brazil (4.9%, a difference of 0.050%), Immigrants from South Eastern Asia (4.9%, a difference of 0.060%), and Ottawa (4.9%, a difference of 0.060%).
| Demographics | Rating | Rank | Unemployment Among Ages 60 to 64 years |
| Sierra Leoneans | 16.5 /100 | #209 | Poor 4.9% |
| Cherokee | 16.1 /100 | #210 | Poor 4.9% |
| Blackfeet | 15.7 /100 | #211 | Poor 4.9% |
| Moroccans | 15.0 /100 | #212 | Poor 4.9% |
| Eastern Europeans | 14.3 /100 | #213 | Poor 4.9% |
| Immigrants | Russia | 13.7 /100 | #214 | Poor 4.9% |
| Immigrants | South Eastern Asia | 13.1 /100 | #215 | Poor 4.9% |
| Cajuns | 12.3 /100 | #216 | Poor 4.9% |
| Koreans | 12.2 /100 | #217 | Poor 4.9% |
| Immigrants | Singapore | 12.0 /100 | #218 | Poor 4.9% |
| Immigrants | Brazil | 11.7 /100 | #219 | Poor 4.9% |
| Ottawa | 11.6 /100 | #220 | Poor 4.9% |
| Ugandans | 10.5 /100 | #221 | Poor 4.9% |
| Brazilians | 10.1 /100 | #222 | Poor 5.0% |
| Crow | 9.7 /100 | #223 | Tragic 5.0% |