Immigrants from Eastern Europe vs Cajun Unemployment Among Ages 60 to 64 years
COMPARE
Immigrants from Eastern Europe
Cajun
Unemployment Among Ages 60 to 64 years
Unemployment Among Ages 60 to 64 years Comparison
Immigrants from Eastern Europe
Cajuns
4.9%
UNEMPLOYMENT AMONG AGES 60 TO 64 YEARS
25.2/ 100
METRIC RATING
197th/ 347
METRIC RANK
4.9%
UNEMPLOYMENT AMONG AGES 60 TO 64 YEARS
12.3/ 100
METRIC RATING
216th/ 347
METRIC RANK
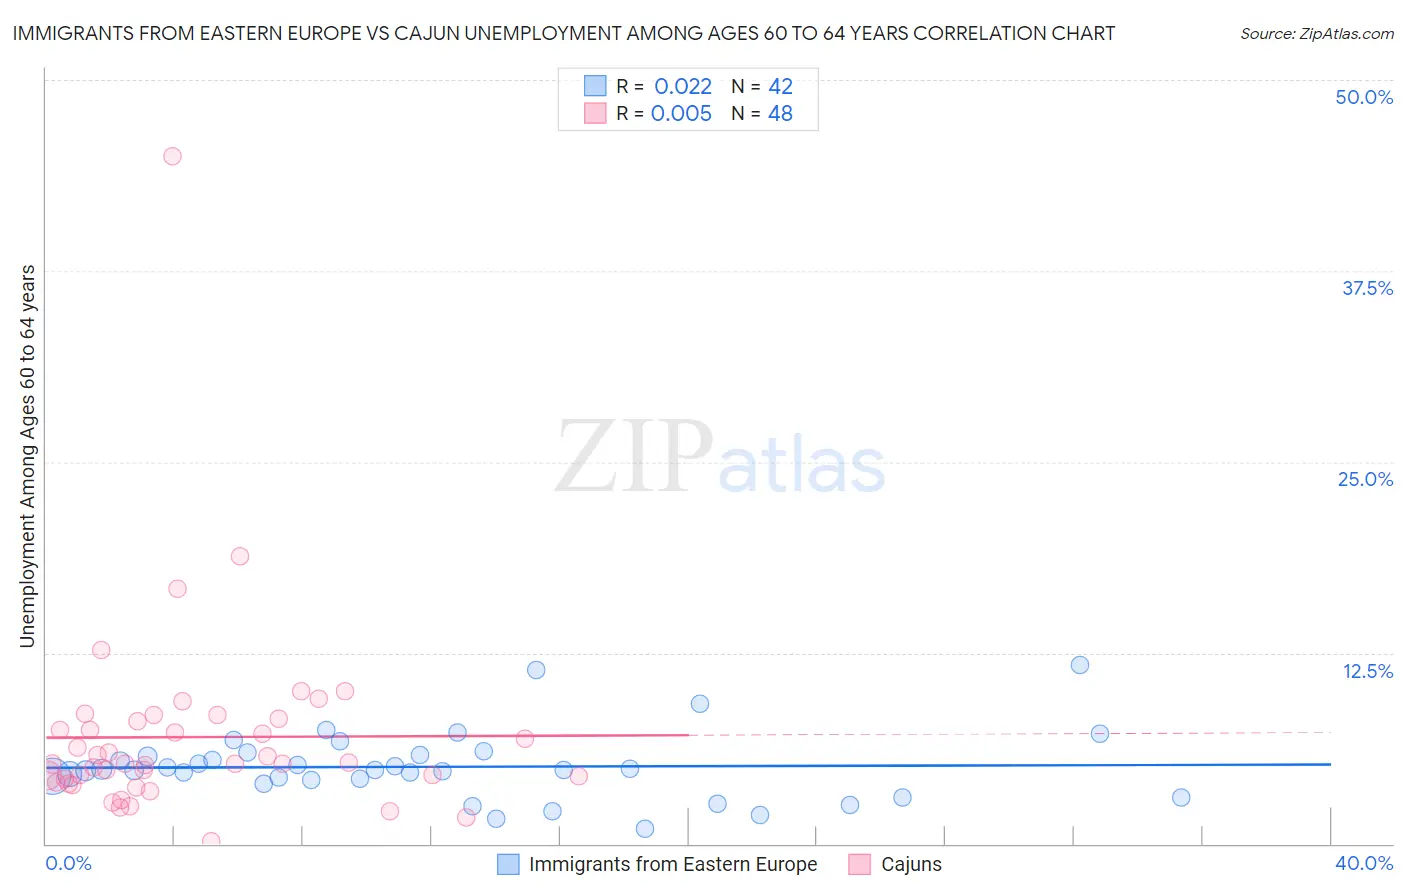
Immigrants from Eastern Europe vs Cajun Unemployment Among Ages 60 to 64 years Correlation Chart
The statistical analysis conducted on geographies consisting of 417,890,092 people shows no correlation between the proportion of Immigrants from Eastern Europe and unemployment rate among population between the ages 60 and 64 in the United States with a correlation coefficient (R) of 0.022 and weighted average of 4.9%. Similarly, the statistical analysis conducted on geographies consisting of 139,908,047 people shows no correlation between the proportion of Cajuns and unemployment rate among population between the ages 60 and 64 in the United States with a correlation coefficient (R) of 0.005 and weighted average of 4.9%, a difference of 0.76%.
Unemployment Among Ages 60 to 64 years Correlation Summary
| Measurement | Immigrants from Eastern Europe | Cajun |
| Minimum | 1.0% | 0.20% |
| Maximum | 11.7% | 45.0% |
| Range | 10.7% | 44.8% |
| Mean | 5.0% | 7.0% |
| Median | 4.8% | 5.2% |
| Interquartile 25% (IQ1) | 4.2% | 4.1% |
| Interquartile 75% (IQ3) | 5.8% | 8.1% |
| Interquartile Range (IQR) | 1.6% | 4.0% |
| Standard Deviation (Sample) | 2.2% | 6.6% |
| Standard Deviation (Population) | 2.2% | 6.5% |
Demographics Similar to Immigrants from Eastern Europe and Cajuns by Unemployment Among Ages 60 to 64 years
In terms of unemployment among ages 60 to 64 years, the demographic groups most similar to Immigrants from Eastern Europe are Immigrants from Asia (4.9%, a difference of 0.030%), Guamanian/Chamorro (4.9%, a difference of 0.070%), Immigrants from Vietnam (4.9%, a difference of 0.070%), Immigrants from Czechoslovakia (4.9%, a difference of 0.080%), and Colombian (4.9%, a difference of 0.12%). Similarly, the demographic groups most similar to Cajuns are Immigrants from South Eastern Asia (4.9%, a difference of 0.060%), Immigrants from Russia (4.9%, a difference of 0.11%), Eastern European (4.9%, a difference of 0.15%), Moroccan (4.9%, a difference of 0.20%), and Blackfeet (4.9%, a difference of 0.25%).
| Demographics | Rating | Rank | Unemployment Among Ages 60 to 64 years |
| Immigrants | Asia | 25.7 /100 | #196 | Fair 4.9% |
| Immigrants | Eastern Europe | 25.2 /100 | #197 | Fair 4.9% |
| Guamanians/Chamorros | 23.7 /100 | #198 | Fair 4.9% |
| Immigrants | Vietnam | 23.7 /100 | #199 | Fair 4.9% |
| Immigrants | Czechoslovakia | 23.5 /100 | #200 | Fair 4.9% |
| Colombians | 22.7 /100 | #201 | Fair 4.9% |
| Immigrants | Western Africa | 20.6 /100 | #202 | Fair 4.9% |
| Uruguayans | 19.9 /100 | #203 | Poor 4.9% |
| Russians | 18.9 /100 | #204 | Poor 4.9% |
| Immigrants | Indonesia | 17.4 /100 | #205 | Poor 4.9% |
| New Zealanders | 17.4 /100 | #206 | Poor 4.9% |
| Chippewa | 17.3 /100 | #207 | Poor 4.9% |
| German Russians | 16.8 /100 | #208 | Poor 4.9% |
| Sierra Leoneans | 16.5 /100 | #209 | Poor 4.9% |
| Cherokee | 16.1 /100 | #210 | Poor 4.9% |
| Blackfeet | 15.7 /100 | #211 | Poor 4.9% |
| Moroccans | 15.0 /100 | #212 | Poor 4.9% |
| Eastern Europeans | 14.3 /100 | #213 | Poor 4.9% |
| Immigrants | Russia | 13.7 /100 | #214 | Poor 4.9% |
| Immigrants | South Eastern Asia | 13.1 /100 | #215 | Poor 4.9% |
| Cajuns | 12.3 /100 | #216 | Poor 4.9% |