Immigrants from Liberia vs Immigrants from Japan Unemployment Among Ages 20 to 24 years
COMPARE
Immigrants from Liberia
Immigrants from Japan
Unemployment Among Ages 20 to 24 years
Unemployment Among Ages 20 to 24 years Comparison
Immigrants from Liberia
Immigrants from Japan
11.1%
UNEMPLOYMENT AMONG AGES 20 TO 24 YEARS
0.0/ 100
METRIC RATING
266th/ 347
METRIC RANK
10.1%
UNEMPLOYMENT AMONG AGES 20 TO 24 YEARS
86.5/ 100
METRIC RATING
124th/ 347
METRIC RANK
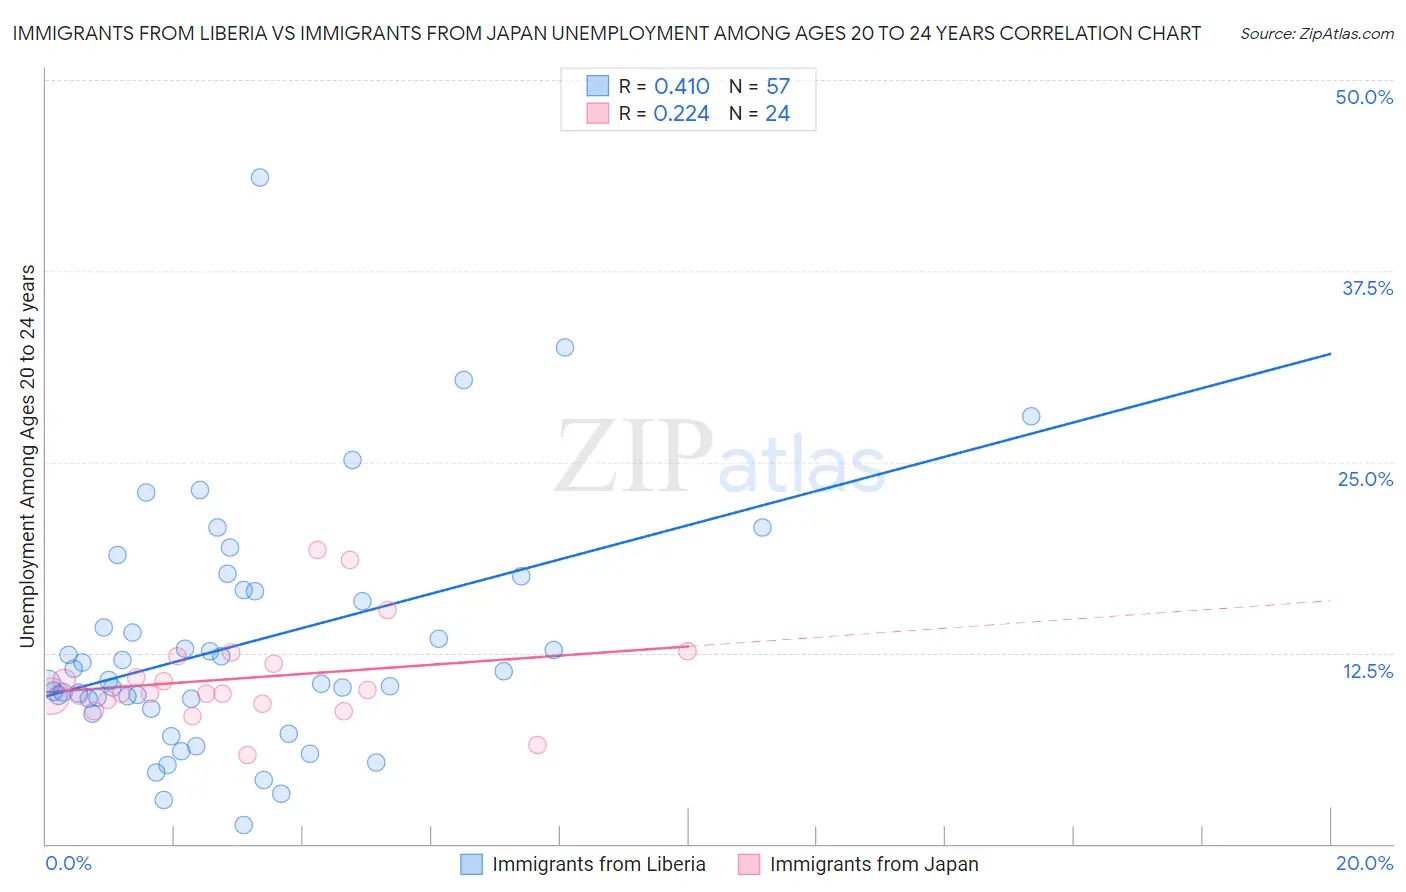
Immigrants from Liberia vs Immigrants from Japan Unemployment Among Ages 20 to 24 years Correlation Chart
The statistical analysis conducted on geographies consisting of 134,103,977 people shows a moderate positive correlation between the proportion of Immigrants from Liberia and unemployment rate among population between the ages 20 and 24 in the United States with a correlation coefficient (R) of 0.410 and weighted average of 11.1%. Similarly, the statistical analysis conducted on geographies consisting of 332,545,610 people shows a weak positive correlation between the proportion of Immigrants from Japan and unemployment rate among population between the ages 20 and 24 in the United States with a correlation coefficient (R) of 0.224 and weighted average of 10.1%, a difference of 9.5%.
Unemployment Among Ages 20 to 24 years Correlation Summary
| Measurement | Immigrants from Liberia | Immigrants from Japan |
| Minimum | 1.2% | 5.8% |
| Maximum | 43.6% | 19.2% |
| Range | 42.4% | 13.5% |
| Mean | 13.1% | 10.8% |
| Median | 10.7% | 9.8% |
| Interquartile 25% (IQ1) | 9.2% | 9.3% |
| Interquartile 75% (IQ3) | 16.6% | 12.0% |
| Interquartile Range (IQR) | 7.4% | 2.7% |
| Standard Deviation (Sample) | 7.9% | 3.2% |
| Standard Deviation (Population) | 7.8% | 3.1% |
Similar Demographics by Unemployment Among Ages 20 to 24 years
Demographics Similar to Immigrants from Liberia by Unemployment Among Ages 20 to 24 years
In terms of unemployment among ages 20 to 24 years, the demographic groups most similar to Immigrants from Liberia are Immigrants from Ireland (11.1%, a difference of 0.090%), Subsaharan African (11.1%, a difference of 0.16%), Immigrants from Greece (11.1%, a difference of 0.28%), Maltese (11.2%, a difference of 0.72%), and Marshallese (11.0%, a difference of 0.91%).
| Demographics | Rating | Rank | Unemployment Among Ages 20 to 24 years |
| Panamanians | 0.2 /100 | #259 | Tragic 10.9% |
| Immigrants | Lebanon | 0.2 /100 | #260 | Tragic 10.9% |
| Puget Sound Salish | 0.2 /100 | #261 | Tragic 10.9% |
| Immigrants | Latin America | 0.1 /100 | #262 | Tragic 11.0% |
| Marshallese | 0.1 /100 | #263 | Tragic 11.0% |
| Sub-Saharan Africans | 0.0 /100 | #264 | Tragic 11.1% |
| Immigrants | Ireland | 0.0 /100 | #265 | Tragic 11.1% |
| Immigrants | Liberia | 0.0 /100 | #266 | Tragic 11.1% |
| Immigrants | Greece | 0.0 /100 | #267 | Tragic 11.1% |
| Maltese | 0.0 /100 | #268 | Tragic 11.2% |
| Ute | 0.0 /100 | #269 | Tragic 11.2% |
| Delaware | 0.0 /100 | #270 | Tragic 11.3% |
| Immigrants | Uzbekistan | 0.0 /100 | #271 | Tragic 11.4% |
| Nigerians | 0.0 /100 | #272 | Tragic 11.4% |
| Immigrants | Nigeria | 0.0 /100 | #273 | Tragic 11.5% |
Demographics Similar to Immigrants from Japan by Unemployment Among Ages 20 to 24 years
In terms of unemployment among ages 20 to 24 years, the demographic groups most similar to Immigrants from Japan are Spanish (10.1%, a difference of 0.030%), Jordanian (10.1%, a difference of 0.030%), Immigrants from Iraq (10.1%, a difference of 0.050%), White/Caucasian (10.1%, a difference of 0.070%), and Immigrants from Norway (10.1%, a difference of 0.090%).
| Demographics | Rating | Rank | Unemployment Among Ages 20 to 24 years |
| Immigrants | Uruguay | 89.6 /100 | #117 | Excellent 10.1% |
| Paraguayans | 88.6 /100 | #118 | Excellent 10.1% |
| French | 88.2 /100 | #119 | Excellent 10.1% |
| Immigrants | Canada | 88.2 /100 | #120 | Excellent 10.1% |
| South Africans | 87.8 /100 | #121 | Excellent 10.1% |
| Whites/Caucasians | 87.4 /100 | #122 | Excellent 10.1% |
| Immigrants | Iraq | 87.1 /100 | #123 | Excellent 10.1% |
| Immigrants | Japan | 86.5 /100 | #124 | Excellent 10.1% |
| Spanish | 86.1 /100 | #125 | Excellent 10.1% |
| Jordanians | 86.1 /100 | #126 | Excellent 10.1% |
| Immigrants | Norway | 85.3 /100 | #127 | Excellent 10.1% |
| Immigrants | Brazil | 84.9 /100 | #128 | Excellent 10.1% |
| Immigrants | South Central Asia | 84.6 /100 | #129 | Excellent 10.1% |
| Immigrants | Lithuania | 84.2 /100 | #130 | Excellent 10.1% |
| Seminole | 84.2 /100 | #131 | Excellent 10.1% |