Immigrants from Liberia vs Immigrants from Cameroon Unemployment Among Ages 20 to 24 years
COMPARE
Immigrants from Liberia
Immigrants from Cameroon
Unemployment Among Ages 20 to 24 years
Unemployment Among Ages 20 to 24 years Comparison
Immigrants from Liberia
Immigrants from Cameroon
11.1%
UNEMPLOYMENT AMONG AGES 20 TO 24 YEARS
0.0/ 100
METRIC RATING
266th/ 347
METRIC RANK
11.7%
UNEMPLOYMENT AMONG AGES 20 TO 24 YEARS
0.0/ 100
METRIC RATING
282nd/ 347
METRIC RANK
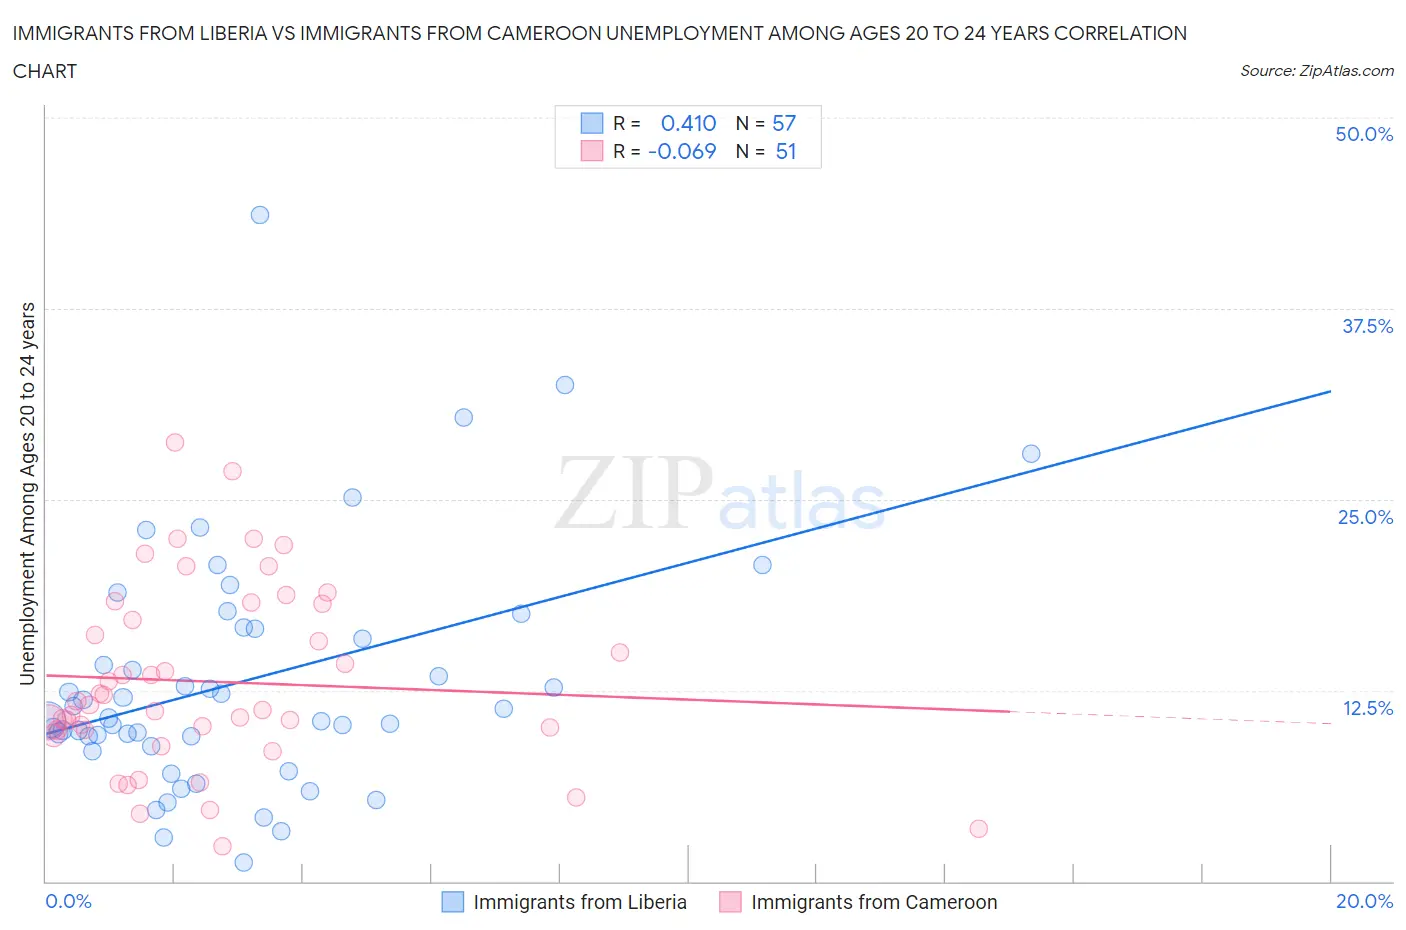
Immigrants from Liberia vs Immigrants from Cameroon Unemployment Among Ages 20 to 24 years Correlation Chart
The statistical analysis conducted on geographies consisting of 134,103,977 people shows a moderate positive correlation between the proportion of Immigrants from Liberia and unemployment rate among population between the ages 20 and 24 in the United States with a correlation coefficient (R) of 0.410 and weighted average of 11.1%. Similarly, the statistical analysis conducted on geographies consisting of 129,677,479 people shows a slight negative correlation between the proportion of Immigrants from Cameroon and unemployment rate among population between the ages 20 and 24 in the United States with a correlation coefficient (R) of -0.069 and weighted average of 11.7%, a difference of 5.4%.
Unemployment Among Ages 20 to 24 years Correlation Summary
| Measurement | Immigrants from Liberia | Immigrants from Cameroon |
| Minimum | 1.2% | 2.3% |
| Maximum | 43.6% | 28.7% |
| Range | 42.4% | 26.5% |
| Mean | 13.1% | 13.1% |
| Median | 10.7% | 11.6% |
| Interquartile 25% (IQ1) | 9.2% | 9.9% |
| Interquartile 75% (IQ3) | 16.6% | 18.2% |
| Interquartile Range (IQR) | 7.4% | 8.3% |
| Standard Deviation (Sample) | 7.9% | 6.0% |
| Standard Deviation (Population) | 7.8% | 5.9% |
Demographics Similar to Immigrants from Liberia and Immigrants from Cameroon by Unemployment Among Ages 20 to 24 years
In terms of unemployment among ages 20 to 24 years, the demographic groups most similar to Immigrants from Liberia are Immigrants from Ireland (11.1%, a difference of 0.090%), Subsaharan African (11.1%, a difference of 0.16%), Immigrants from Greece (11.1%, a difference of 0.28%), Maltese (11.2%, a difference of 0.72%), and Ute (11.2%, a difference of 1.1%). Similarly, the demographic groups most similar to Immigrants from Cameroon are Armenian (11.7%, a difference of 0.15%), Ghanaian (11.7%, a difference of 0.34%), Immigrants from Western Africa (11.7%, a difference of 0.35%), Alaskan Athabascan (11.6%, a difference of 0.62%), and Bahamian (11.6%, a difference of 0.97%).
| Demographics | Rating | Rank | Unemployment Among Ages 20 to 24 years |
| Sub-Saharan Africans | 0.0 /100 | #264 | Tragic 11.1% |
| Immigrants | Ireland | 0.0 /100 | #265 | Tragic 11.1% |
| Immigrants | Liberia | 0.0 /100 | #266 | Tragic 11.1% |
| Immigrants | Greece | 0.0 /100 | #267 | Tragic 11.1% |
| Maltese | 0.0 /100 | #268 | Tragic 11.2% |
| Ute | 0.0 /100 | #269 | Tragic 11.2% |
| Delaware | 0.0 /100 | #270 | Tragic 11.3% |
| Immigrants | Uzbekistan | 0.0 /100 | #271 | Tragic 11.4% |
| Nigerians | 0.0 /100 | #272 | Tragic 11.4% |
| Immigrants | Nigeria | 0.0 /100 | #273 | Tragic 11.5% |
| Cape Verdeans | 0.0 /100 | #274 | Tragic 11.5% |
| Senegalese | 0.0 /100 | #275 | Tragic 11.5% |
| Sierra Leoneans | 0.0 /100 | #276 | Tragic 11.5% |
| Africans | 0.0 /100 | #277 | Tragic 11.5% |
| Colville | 0.0 /100 | #278 | Tragic 11.6% |
| Bahamians | 0.0 /100 | #279 | Tragic 11.6% |
| Alaskan Athabascans | 0.0 /100 | #280 | Tragic 11.6% |
| Armenians | 0.0 /100 | #281 | Tragic 11.7% |
| Immigrants | Cameroon | 0.0 /100 | #282 | Tragic 11.7% |
| Ghanaians | 0.0 /100 | #283 | Tragic 11.7% |
| Immigrants | Western Africa | 0.0 /100 | #284 | Tragic 11.7% |