Immigrants from Lebanon vs Immigrants from Moldova Unemployment Among Women with Children Ages 6 to 17 years
COMPARE
Immigrants from Lebanon
Immigrants from Moldova
Unemployment Among Women with Children Ages 6 to 17 years
Unemployment Among Women with Children Ages 6 to 17 years Comparison
Immigrants from Lebanon
Immigrants from Moldova
8.7%
UNEMPLOYMENT AMONG WOMEN WITH CHILDREN AGES 6 TO 17 YEARS
94.9/ 100
METRIC RATING
124th/ 347
METRIC RANK
8.4%
UNEMPLOYMENT AMONG WOMEN WITH CHILDREN AGES 6 TO 17 YEARS
99.7/ 100
METRIC RATING
76th/ 347
METRIC RANK
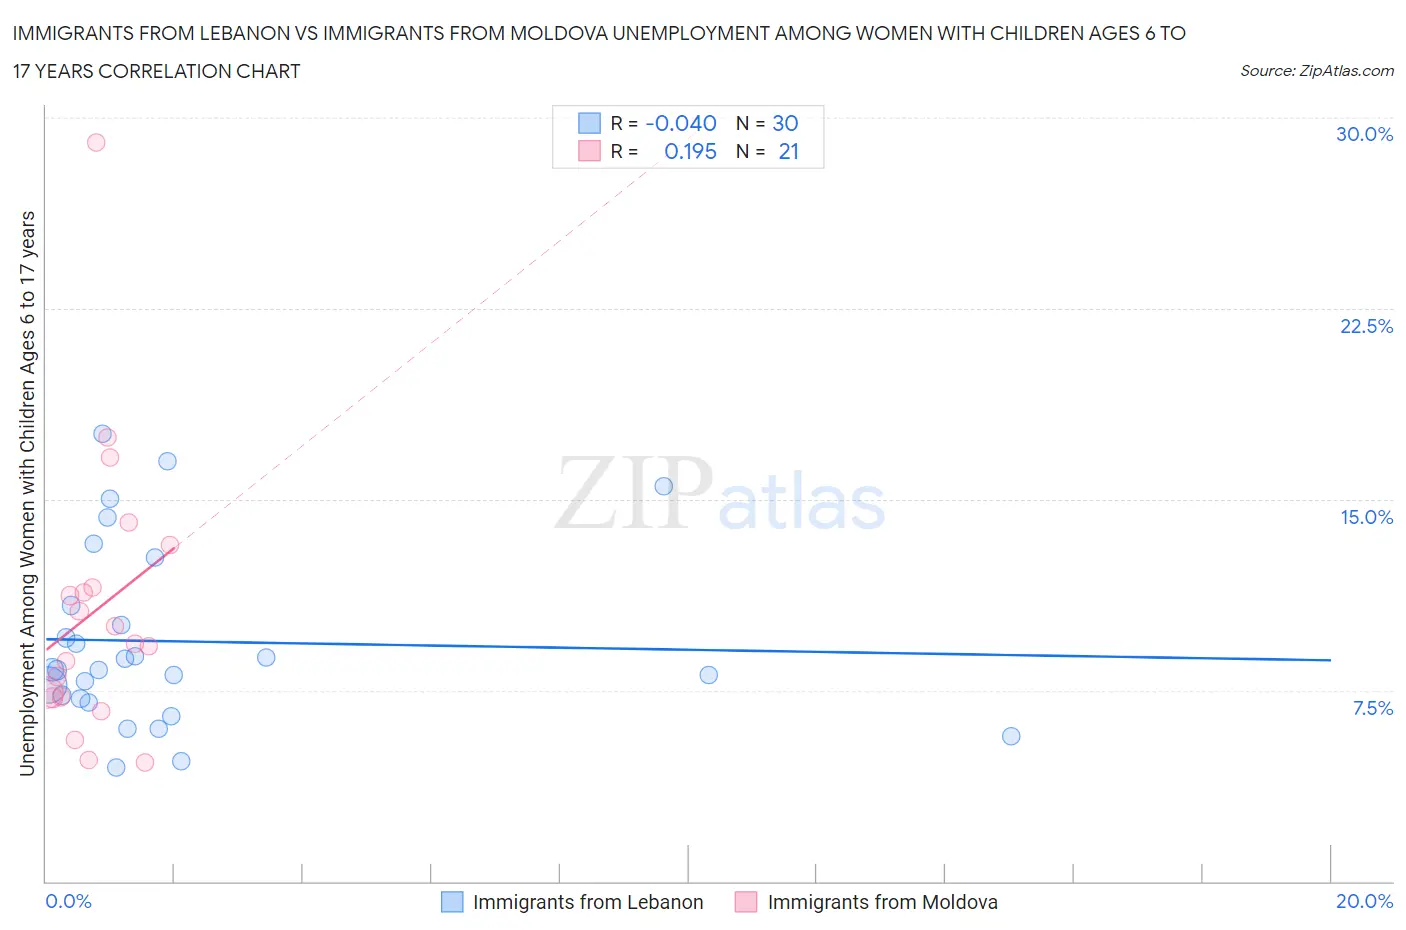
Immigrants from Lebanon vs Immigrants from Moldova Unemployment Among Women with Children Ages 6 to 17 years Correlation Chart
The statistical analysis conducted on geographies consisting of 171,151,973 people shows no correlation between the proportion of Immigrants from Lebanon and unemployment rate among women with children between the ages 6 and 17 in the United States with a correlation coefficient (R) of -0.040 and weighted average of 8.7%. Similarly, the statistical analysis conducted on geographies consisting of 104,002,938 people shows a poor positive correlation between the proportion of Immigrants from Moldova and unemployment rate among women with children between the ages 6 and 17 in the United States with a correlation coefficient (R) of 0.195 and weighted average of 8.4%, a difference of 3.4%.
Unemployment Among Women with Children Ages 6 to 17 years Correlation Summary
| Measurement | Immigrants from Lebanon | Immigrants from Moldova |
| Minimum | 4.5% | 4.7% |
| Maximum | 17.6% | 29.0% |
| Range | 13.1% | 24.3% |
| Mean | 9.4% | 10.7% |
| Median | 8.3% | 9.3% |
| Interquartile 25% (IQ1) | 7.2% | 7.2% |
| Interquartile 75% (IQ3) | 10.8% | 12.4% |
| Interquartile Range (IQR) | 3.7% | 5.1% |
| Standard Deviation (Sample) | 3.5% | 5.5% |
| Standard Deviation (Population) | 3.5% | 5.3% |
Similar Demographics by Unemployment Among Women with Children Ages 6 to 17 years
Demographics Similar to Immigrants from Lebanon by Unemployment Among Women with Children Ages 6 to 17 years
In terms of unemployment among women with children ages 6 to 17 years, the demographic groups most similar to Immigrants from Lebanon are Immigrants from Morocco (8.7%, a difference of 0.0%), Immigrants from Egypt (8.7%, a difference of 0.040%), South African (8.7%, a difference of 0.070%), Immigrants from Northern Africa (8.7%, a difference of 0.10%), and Czech (8.7%, a difference of 0.10%).
| Demographics | Rating | Rank | Unemployment Among Women with Children Ages 6 to 17 years |
| Albanians | 96.3 /100 | #117 | Exceptional 8.6% |
| Pueblo | 96.2 /100 | #118 | Exceptional 8.6% |
| Immigrants | Grenada | 96.2 /100 | #119 | Exceptional 8.6% |
| Israelis | 95.9 /100 | #120 | Exceptional 8.7% |
| Immigrants | Denmark | 95.5 /100 | #121 | Exceptional 8.7% |
| Immigrants | Egypt | 95.0 /100 | #122 | Exceptional 8.7% |
| Immigrants | Morocco | 94.9 /100 | #123 | Exceptional 8.7% |
| Immigrants | Lebanon | 94.9 /100 | #124 | Exceptional 8.7% |
| South Africans | 94.6 /100 | #125 | Exceptional 8.7% |
| Immigrants | Northern Africa | 94.4 /100 | #126 | Exceptional 8.7% |
| Czechs | 94.4 /100 | #127 | Exceptional 8.7% |
| Hmong | 94.3 /100 | #128 | Exceptional 8.7% |
| Barbadians | 93.8 /100 | #129 | Exceptional 8.7% |
| Immigrants | Western Asia | 93.1 /100 | #130 | Exceptional 8.7% |
| Slavs | 92.2 /100 | #131 | Exceptional 8.7% |
Demographics Similar to Immigrants from Moldova by Unemployment Among Women with Children Ages 6 to 17 years
In terms of unemployment among women with children ages 6 to 17 years, the demographic groups most similar to Immigrants from Moldova are Immigrants from Sri Lanka (8.4%, a difference of 0.020%), Iraqi (8.4%, a difference of 0.050%), Samoan (8.4%, a difference of 0.11%), Pakistani (8.4%, a difference of 0.19%), and Mongolian (8.4%, a difference of 0.20%).
| Demographics | Rating | Rank | Unemployment Among Women with Children Ages 6 to 17 years |
| Immigrants | Thailand | 99.9 /100 | #69 | Exceptional 8.3% |
| Norwegians | 99.9 /100 | #70 | Exceptional 8.3% |
| Immigrants | Australia | 99.8 /100 | #71 | Exceptional 8.3% |
| Immigrants | Nepal | 99.8 /100 | #72 | Exceptional 8.3% |
| Spanish Americans | 99.8 /100 | #73 | Exceptional 8.4% |
| Samoans | 99.7 /100 | #74 | Exceptional 8.4% |
| Immigrants | Sri Lanka | 99.7 /100 | #75 | Exceptional 8.4% |
| Immigrants | Moldova | 99.7 /100 | #76 | Exceptional 8.4% |
| Iraqis | 99.7 /100 | #77 | Exceptional 8.4% |
| Pakistanis | 99.6 /100 | #78 | Exceptional 8.4% |
| Mongolians | 99.6 /100 | #79 | Exceptional 8.4% |
| Immigrants | Belarus | 99.6 /100 | #80 | Exceptional 8.4% |
| Immigrants | Bolivia | 99.6 /100 | #81 | Exceptional 8.4% |
| Cypriots | 99.6 /100 | #82 | Exceptional 8.4% |
| Bulgarians | 99.5 /100 | #83 | Exceptional 8.4% |