Immigrants from Latin America vs Portuguese Unemployment Among Ages 45 to 54 years
COMPARE
Immigrants from Latin America
Portuguese
Unemployment Among Ages 45 to 54 years
Unemployment Among Ages 45 to 54 years Comparison
Immigrants from Latin America
Portuguese
5.0%
UNEMPLOYMENT AMONG AGES 45 TO 54 YEARS
0.0/ 100
METRIC RATING
273rd/ 347
METRIC RANK
4.8%
UNEMPLOYMENT AMONG AGES 45 TO 54 YEARS
1.1/ 100
METRIC RATING
243rd/ 347
METRIC RANK
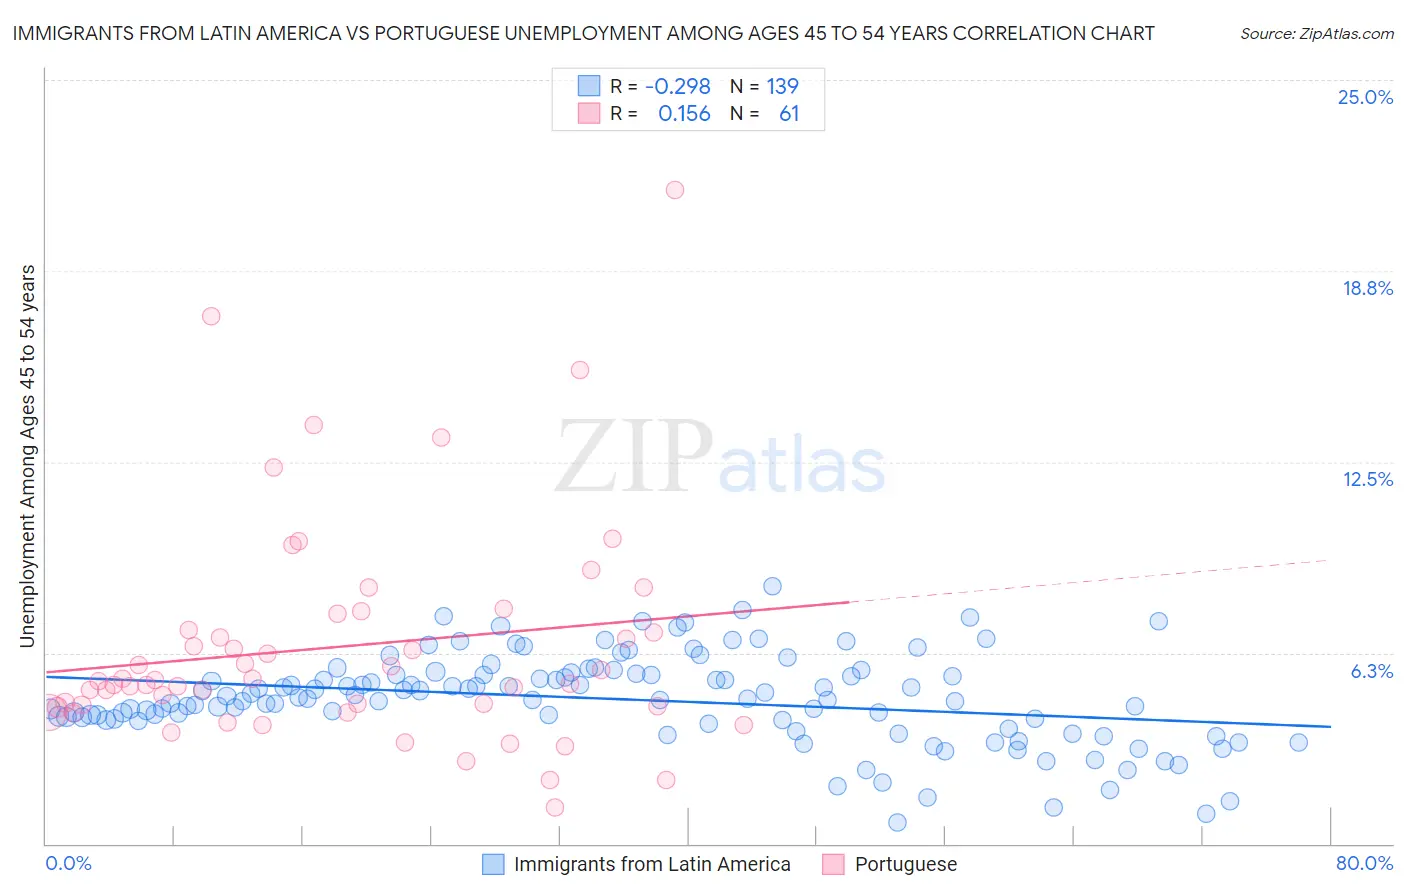
Immigrants from Latin America vs Portuguese Unemployment Among Ages 45 to 54 years Correlation Chart
The statistical analysis conducted on geographies consisting of 523,180,002 people shows a weak negative correlation between the proportion of Immigrants from Latin America and unemployment rate among population between the ages 45 and 54 in the United States with a correlation coefficient (R) of -0.298 and weighted average of 5.0%. Similarly, the statistical analysis conducted on geographies consisting of 434,727,721 people shows a poor positive correlation between the proportion of Portuguese and unemployment rate among population between the ages 45 and 54 in the United States with a correlation coefficient (R) of 0.156 and weighted average of 4.8%, a difference of 4.8%.
Unemployment Among Ages 45 to 54 years Correlation Summary
| Measurement | Immigrants from Latin America | Portuguese |
| Minimum | 0.70% | 1.2% |
| Maximum | 8.4% | 21.4% |
| Range | 7.7% | 20.2% |
| Mean | 4.7% | 6.5% |
| Median | 4.8% | 5.3% |
| Interquartile 25% (IQ1) | 4.1% | 4.5% |
| Interquartile 75% (IQ3) | 5.5% | 7.3% |
| Interquartile Range (IQR) | 1.5% | 2.8% |
| Standard Deviation (Sample) | 1.4% | 3.7% |
| Standard Deviation (Population) | 1.4% | 3.6% |
Similar Demographics by Unemployment Among Ages 45 to 54 years
Demographics Similar to Immigrants from Latin America by Unemployment Among Ages 45 to 54 years
In terms of unemployment among ages 45 to 54 years, the demographic groups most similar to Immigrants from Latin America are U.S. Virgin Islander (5.0%, a difference of 0.050%), Bermudan (5.0%, a difference of 0.10%), Immigrants from Central America (5.0%, a difference of 0.16%), Cajun (5.0%, a difference of 0.33%), and Immigrants from Ghana (5.0%, a difference of 0.41%).
| Demographics | Rating | Rank | Unemployment Among Ages 45 to 54 years |
| Ghanaians | 0.0 /100 | #266 | Tragic 4.9% |
| Bahamians | 0.0 /100 | #267 | Tragic 4.9% |
| Immigrants | Uzbekistan | 0.0 /100 | #268 | Tragic 4.9% |
| Somalis | 0.0 /100 | #269 | Tragic 5.0% |
| Immigrants | Ghana | 0.0 /100 | #270 | Tragic 5.0% |
| Cajuns | 0.0 /100 | #271 | Tragic 5.0% |
| Immigrants | Central America | 0.0 /100 | #272 | Tragic 5.0% |
| Immigrants | Latin America | 0.0 /100 | #273 | Tragic 5.0% |
| U.S. Virgin Islanders | 0.0 /100 | #274 | Tragic 5.0% |
| Bermudans | 0.0 /100 | #275 | Tragic 5.0% |
| French American Indians | 0.0 /100 | #276 | Tragic 5.0% |
| Immigrants | Mexico | 0.0 /100 | #277 | Tragic 5.0% |
| Dutch West Indians | 0.0 /100 | #278 | Tragic 5.0% |
| Nepalese | 0.0 /100 | #279 | Tragic 5.0% |
| Blackfeet | 0.0 /100 | #280 | Tragic 5.1% |
Demographics Similar to Portuguese by Unemployment Among Ages 45 to 54 years
In terms of unemployment among ages 45 to 54 years, the demographic groups most similar to Portuguese are Seminole (4.8%, a difference of 0.060%), Central American (4.8%, a difference of 0.11%), Delaware (4.8%, a difference of 0.12%), Immigrants from Iraq (4.7%, a difference of 0.19%), and Immigrants from Albania (4.8%, a difference of 0.21%).
| Demographics | Rating | Rank | Unemployment Among Ages 45 to 54 years |
| Tlingit-Haida | 2.3 /100 | #236 | Tragic 4.7% |
| Alsatians | 1.6 /100 | #237 | Tragic 4.7% |
| Yaqui | 1.4 /100 | #238 | Tragic 4.7% |
| Spanish Americans | 1.4 /100 | #239 | Tragic 4.7% |
| Immigrants | Iraq | 1.3 /100 | #240 | Tragic 4.7% |
| Delaware | 1.3 /100 | #241 | Tragic 4.8% |
| Central Americans | 1.3 /100 | #242 | Tragic 4.8% |
| Portuguese | 1.1 /100 | #243 | Tragic 4.8% |
| Seminole | 1.1 /100 | #244 | Tragic 4.8% |
| Immigrants | Albania | 0.9 /100 | #245 | Tragic 4.8% |
| Immigrants | Syria | 0.9 /100 | #246 | Tragic 4.8% |
| Israelis | 0.9 /100 | #247 | Tragic 4.8% |
| Immigrants | Liberia | 0.8 /100 | #248 | Tragic 4.8% |
| Immigrants | Honduras | 0.7 /100 | #249 | Tragic 4.8% |
| Salvadorans | 0.7 /100 | #250 | Tragic 4.8% |