Icelander vs Portuguese Unemployment Among Ages 45 to 54 years
COMPARE
Icelander
Portuguese
Unemployment Among Ages 45 to 54 years
Unemployment Among Ages 45 to 54 years Comparison
Icelanders
Portuguese
4.4%
UNEMPLOYMENT AMONG AGES 45 TO 54 YEARS
93.5/ 100
METRIC RATING
103rd/ 347
METRIC RANK
4.8%
UNEMPLOYMENT AMONG AGES 45 TO 54 YEARS
1.1/ 100
METRIC RATING
243rd/ 347
METRIC RANK
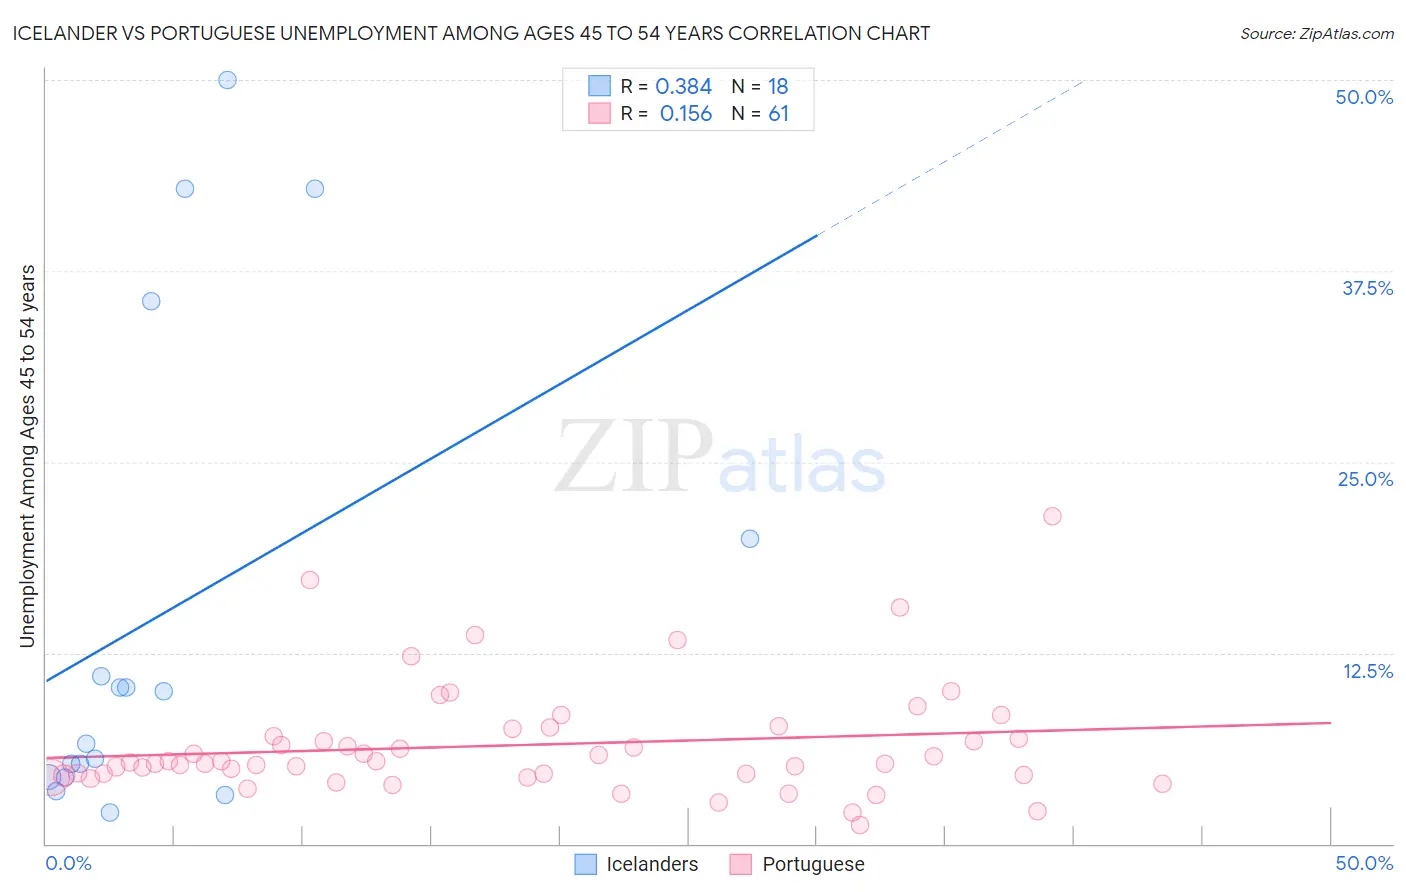
Icelander vs Portuguese Unemployment Among Ages 45 to 54 years Correlation Chart
The statistical analysis conducted on geographies consisting of 157,255,651 people shows a mild positive correlation between the proportion of Icelanders and unemployment rate among population between the ages 45 and 54 in the United States with a correlation coefficient (R) of 0.384 and weighted average of 4.4%. Similarly, the statistical analysis conducted on geographies consisting of 434,727,721 people shows a poor positive correlation between the proportion of Portuguese and unemployment rate among population between the ages 45 and 54 in the United States with a correlation coefficient (R) of 0.156 and weighted average of 4.8%, a difference of 8.6%.
Unemployment Among Ages 45 to 54 years Correlation Summary
| Measurement | Icelander | Portuguese |
| Minimum | 2.1% | 1.2% |
| Maximum | 50.0% | 21.4% |
| Range | 47.9% | 20.2% |
| Mean | 15.2% | 6.5% |
| Median | 8.3% | 5.3% |
| Interquartile 25% (IQ1) | 4.4% | 4.5% |
| Interquartile 75% (IQ3) | 20.0% | 7.3% |
| Interquartile Range (IQR) | 15.6% | 2.8% |
| Standard Deviation (Sample) | 16.0% | 3.7% |
| Standard Deviation (Population) | 15.5% | 3.6% |
Similar Demographics by Unemployment Among Ages 45 to 54 years
Demographics Similar to Icelanders by Unemployment Among Ages 45 to 54 years
In terms of unemployment among ages 45 to 54 years, the demographic groups most similar to Icelanders are Sri Lankan (4.4%, a difference of 0.030%), Immigrants from North America (4.4%, a difference of 0.080%), Immigrants from Sweden (4.4%, a difference of 0.10%), Immigrants from Kenya (4.4%, a difference of 0.13%), and Iranian (4.4%, a difference of 0.19%).
| Demographics | Rating | Rank | Unemployment Among Ages 45 to 54 years |
| Indonesians | 95.4 /100 | #96 | Exceptional 4.4% |
| Immigrants | Canada | 95.0 /100 | #97 | Exceptional 4.4% |
| Romanians | 94.9 /100 | #98 | Exceptional 4.4% |
| Immigrants | Burma/Myanmar | 94.9 /100 | #99 | Exceptional 4.4% |
| Immigrants | Eritrea | 94.7 /100 | #100 | Exceptional 4.4% |
| Immigrants | North America | 93.9 /100 | #101 | Exceptional 4.4% |
| Sri Lankans | 93.7 /100 | #102 | Exceptional 4.4% |
| Icelanders | 93.5 /100 | #103 | Exceptional 4.4% |
| Immigrants | Sweden | 93.0 /100 | #104 | Exceptional 4.4% |
| Immigrants | Kenya | 92.8 /100 | #105 | Exceptional 4.4% |
| Iranians | 92.5 /100 | #106 | Exceptional 4.4% |
| Immigrants | South Africa | 92.5 /100 | #107 | Exceptional 4.4% |
| Russians | 92.1 /100 | #108 | Exceptional 4.4% |
| New Zealanders | 91.9 /100 | #109 | Exceptional 4.4% |
| Immigrants | England | 91.3 /100 | #110 | Exceptional 4.4% |
Demographics Similar to Portuguese by Unemployment Among Ages 45 to 54 years
In terms of unemployment among ages 45 to 54 years, the demographic groups most similar to Portuguese are Seminole (4.8%, a difference of 0.060%), Central American (4.8%, a difference of 0.11%), Delaware (4.8%, a difference of 0.12%), Immigrants from Iraq (4.7%, a difference of 0.19%), and Immigrants from Albania (4.8%, a difference of 0.21%).
| Demographics | Rating | Rank | Unemployment Among Ages 45 to 54 years |
| Tlingit-Haida | 2.3 /100 | #236 | Tragic 4.7% |
| Alsatians | 1.6 /100 | #237 | Tragic 4.7% |
| Yaqui | 1.4 /100 | #238 | Tragic 4.7% |
| Spanish Americans | 1.4 /100 | #239 | Tragic 4.7% |
| Immigrants | Iraq | 1.3 /100 | #240 | Tragic 4.7% |
| Delaware | 1.3 /100 | #241 | Tragic 4.8% |
| Central Americans | 1.3 /100 | #242 | Tragic 4.8% |
| Portuguese | 1.1 /100 | #243 | Tragic 4.8% |
| Seminole | 1.1 /100 | #244 | Tragic 4.8% |
| Immigrants | Albania | 0.9 /100 | #245 | Tragic 4.8% |
| Immigrants | Syria | 0.9 /100 | #246 | Tragic 4.8% |
| Israelis | 0.9 /100 | #247 | Tragic 4.8% |
| Immigrants | Liberia | 0.8 /100 | #248 | Tragic 4.8% |
| Immigrants | Honduras | 0.7 /100 | #249 | Tragic 4.8% |
| Salvadorans | 0.7 /100 | #250 | Tragic 4.8% |