Immigrants from Kuwait vs Bolivian Unemployment Among Women with Children Under 18 years
COMPARE
Immigrants from Kuwait
Bolivian
Unemployment Among Women with Children Under 18 years
Unemployment Among Women with Children Under 18 years Comparison
Immigrants from Kuwait
Bolivians
5.2%
UNEMPLOYMENT AMONG WOMEN WITH CHILDREN UNDER 18 YEARS
92.6/ 100
METRIC RATING
94th/ 347
METRIC RANK
5.1%
UNEMPLOYMENT AMONG WOMEN WITH CHILDREN UNDER 18 YEARS
95.5/ 100
METRIC RATING
80th/ 347
METRIC RANK
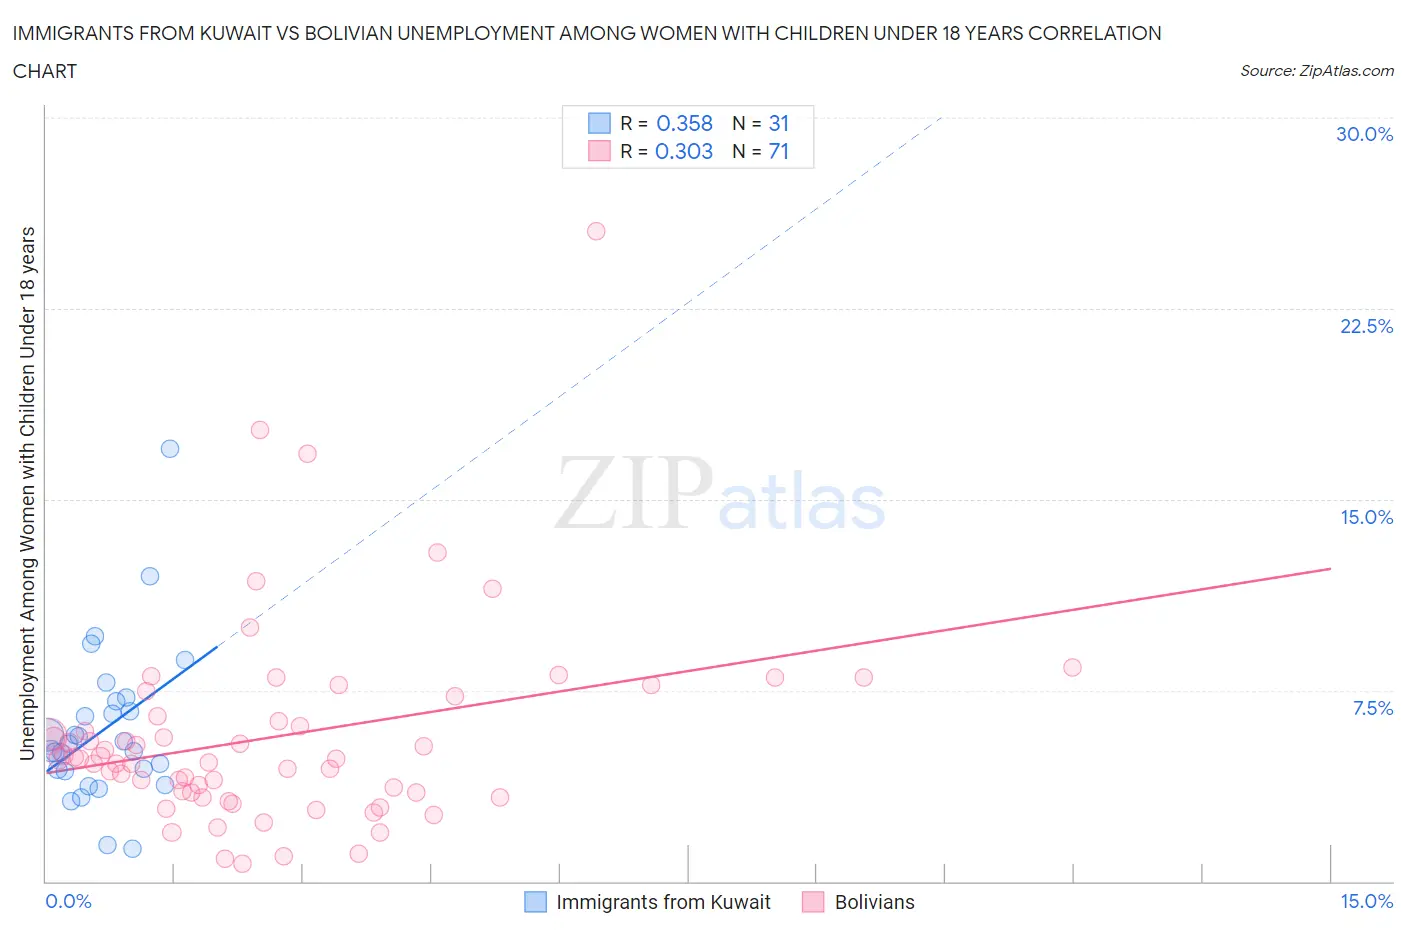
Immigrants from Kuwait vs Bolivian Unemployment Among Women with Children Under 18 years Correlation Chart
The statistical analysis conducted on geographies consisting of 135,399,503 people shows a mild positive correlation between the proportion of Immigrants from Kuwait and unemployment rate among women with children under the age of 18 in the United States with a correlation coefficient (R) of 0.358 and weighted average of 5.2%. Similarly, the statistical analysis conducted on geographies consisting of 181,555,982 people shows a mild positive correlation between the proportion of Bolivians and unemployment rate among women with children under the age of 18 in the United States with a correlation coefficient (R) of 0.303 and weighted average of 5.1%, a difference of 1.0%.
Unemployment Among Women with Children Under 18 years Correlation Summary
| Measurement | Immigrants from Kuwait | Bolivian |
| Minimum | 1.3% | 0.70% |
| Maximum | 17.0% | 25.6% |
| Range | 15.7% | 24.9% |
| Mean | 6.0% | 5.7% |
| Median | 5.4% | 4.8% |
| Interquartile 25% (IQ1) | 4.3% | 3.5% |
| Interquartile 75% (IQ3) | 7.1% | 6.5% |
| Interquartile Range (IQR) | 2.7% | 3.0% |
| Standard Deviation (Sample) | 3.1% | 4.0% |
| Standard Deviation (Population) | 3.0% | 4.0% |
Demographics Similar to Immigrants from Kuwait and Bolivians by Unemployment Among Women with Children Under 18 years
In terms of unemployment among women with children under 18 years, the demographic groups most similar to Immigrants from Kuwait are Immigrants from North America (5.2%, a difference of 0.090%), Immigrants from Albania (5.2%, a difference of 0.11%), Palestinian (5.2%, a difference of 0.11%), Immigrants from Canada (5.2%, a difference of 0.19%), and Immigrants from Pakistan (5.2%, a difference of 0.21%). Similarly, the demographic groups most similar to Bolivians are Immigrants from Lithuania (5.2%, a difference of 0.040%), Immigrants from Croatia (5.1%, a difference of 0.050%), Assyrian/Chaldean/Syriac (5.1%, a difference of 0.070%), Romanian (5.2%, a difference of 0.080%), and Zimbabwean (5.1%, a difference of 0.090%).
| Demographics | Rating | Rank | Unemployment Among Women with Children Under 18 years |
| Zimbabweans | 95.7 /100 | #77 | Exceptional 5.1% |
| Assyrians/Chaldeans/Syriacs | 95.7 /100 | #78 | Exceptional 5.1% |
| Immigrants | Croatia | 95.6 /100 | #79 | Exceptional 5.1% |
| Bolivians | 95.5 /100 | #80 | Exceptional 5.1% |
| Immigrants | Lithuania | 95.4 /100 | #81 | Exceptional 5.2% |
| Romanians | 95.3 /100 | #82 | Exceptional 5.2% |
| Maltese | 95.1 /100 | #83 | Exceptional 5.2% |
| Australians | 95.1 /100 | #84 | Exceptional 5.2% |
| Paraguayans | 94.8 /100 | #85 | Exceptional 5.2% |
| Immigrants | Indonesia | 94.8 /100 | #86 | Exceptional 5.2% |
| Laotians | 94.7 /100 | #87 | Exceptional 5.2% |
| Immigrants | Scotland | 94.5 /100 | #88 | Exceptional 5.2% |
| Immigrants | Turkey | 94.2 /100 | #89 | Exceptional 5.2% |
| Ukrainians | 93.8 /100 | #90 | Exceptional 5.2% |
| Immigrants | Zimbabwe | 93.6 /100 | #91 | Exceptional 5.2% |
| Immigrants | Pakistan | 93.3 /100 | #92 | Exceptional 5.2% |
| Immigrants | Canada | 93.3 /100 | #93 | Exceptional 5.2% |
| Immigrants | Kuwait | 92.6 /100 | #94 | Exceptional 5.2% |
| Immigrants | North America | 92.3 /100 | #95 | Exceptional 5.2% |
| Immigrants | Albania | 92.2 /100 | #96 | Exceptional 5.2% |
| Palestinians | 92.2 /100 | #97 | Exceptional 5.2% |