Hawaiian vs Bolivian Unemployment Among Women with Children Under 18 years
COMPARE
Hawaiian
Bolivian
Unemployment Among Women with Children Under 18 years
Unemployment Among Women with Children Under 18 years Comparison
Hawaiians
Bolivians
5.5%
UNEMPLOYMENT AMONG WOMEN WITH CHILDREN UNDER 18 YEARS
46.1/ 100
METRIC RATING
177th/ 347
METRIC RANK
5.1%
UNEMPLOYMENT AMONG WOMEN WITH CHILDREN UNDER 18 YEARS
95.5/ 100
METRIC RATING
80th/ 347
METRIC RANK
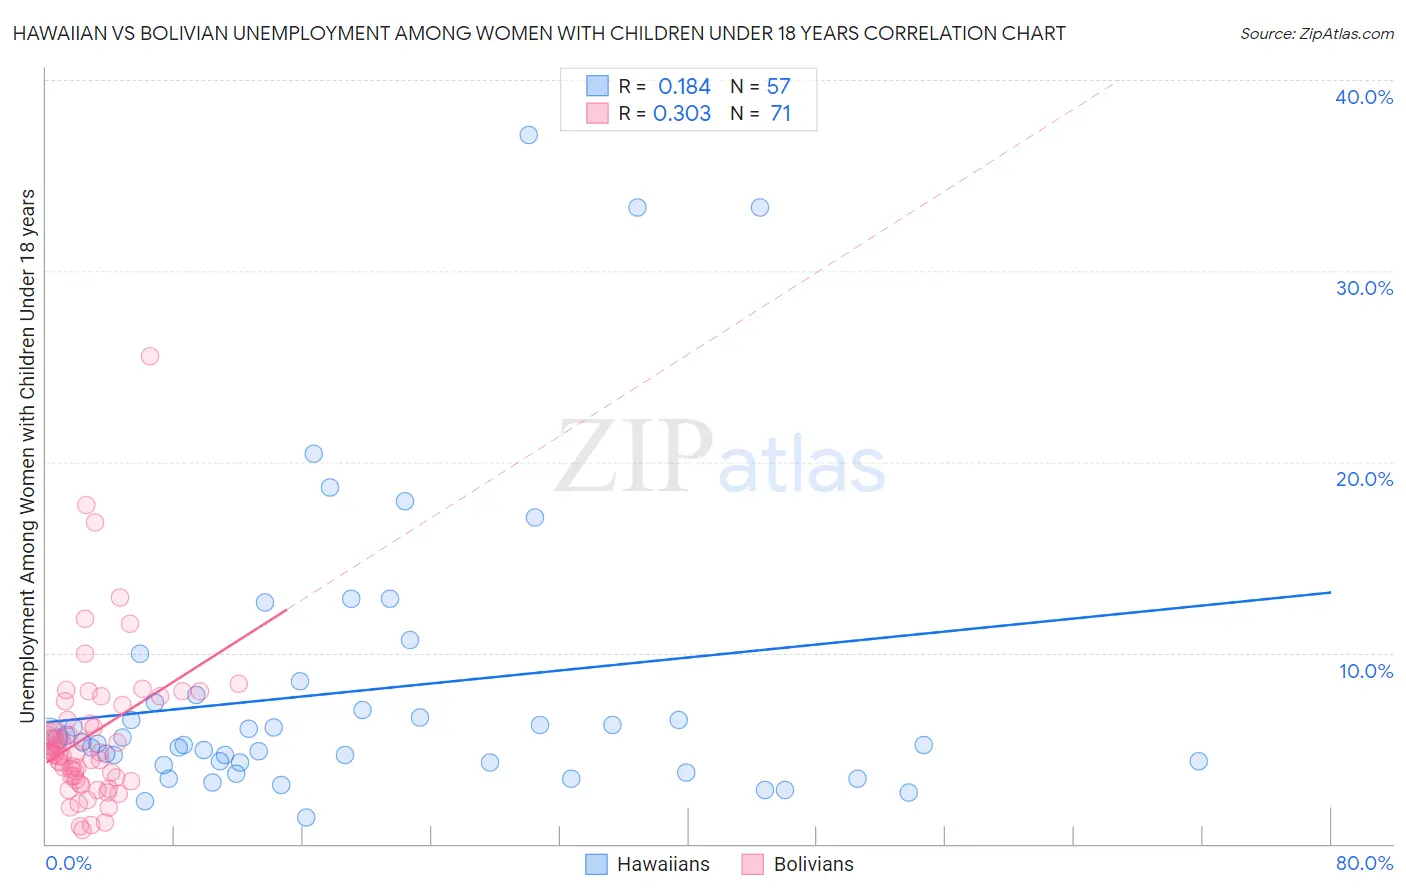
Hawaiian vs Bolivian Unemployment Among Women with Children Under 18 years Correlation Chart
The statistical analysis conducted on geographies consisting of 316,399,402 people shows a poor positive correlation between the proportion of Hawaiians and unemployment rate among women with children under the age of 18 in the United States with a correlation coefficient (R) of 0.184 and weighted average of 5.5%. Similarly, the statistical analysis conducted on geographies consisting of 181,555,982 people shows a mild positive correlation between the proportion of Bolivians and unemployment rate among women with children under the age of 18 in the United States with a correlation coefficient (R) of 0.303 and weighted average of 5.1%, a difference of 6.0%.
Unemployment Among Women with Children Under 18 years Correlation Summary
| Measurement | Hawaiian | Bolivian |
| Minimum | 1.4% | 0.70% |
| Maximum | 37.1% | 25.6% |
| Range | 35.7% | 24.9% |
| Mean | 8.0% | 5.7% |
| Median | 5.3% | 4.8% |
| Interquartile 25% (IQ1) | 4.2% | 3.5% |
| Interquartile 75% (IQ3) | 7.6% | 6.5% |
| Interquartile Range (IQR) | 3.4% | 3.0% |
| Standard Deviation (Sample) | 7.5% | 4.0% |
| Standard Deviation (Population) | 7.5% | 4.0% |
Similar Demographics by Unemployment Among Women with Children Under 18 years
Demographics Similar to Hawaiians by Unemployment Among Women with Children Under 18 years
In terms of unemployment among women with children under 18 years, the demographic groups most similar to Hawaiians are Costa Rican (5.5%, a difference of 0.070%), Immigrants from Germany (5.5%, a difference of 0.17%), Spanish (5.4%, a difference of 0.21%), Syrian (5.5%, a difference of 0.24%), and Immigrants from Southern Europe (5.5%, a difference of 0.24%).
| Demographics | Rating | Rank | Unemployment Among Women with Children Under 18 years |
| Samoans | 54.1 /100 | #170 | Average 5.4% |
| Immigrants | Philippines | 53.1 /100 | #171 | Average 5.4% |
| Immigrants | Kazakhstan | 51.7 /100 | #172 | Average 5.4% |
| Immigrants | Eastern Africa | 51.3 /100 | #173 | Average 5.4% |
| Immigrants | Uzbekistan | 50.0 /100 | #174 | Average 5.4% |
| Spanish | 49.0 /100 | #175 | Average 5.4% |
| Immigrants | Germany | 48.5 /100 | #176 | Average 5.5% |
| Hawaiians | 46.1 /100 | #177 | Average 5.5% |
| Costa Ricans | 45.2 /100 | #178 | Average 5.5% |
| Syrians | 42.8 /100 | #179 | Average 5.5% |
| Immigrants | Southern Europe | 42.7 /100 | #180 | Average 5.5% |
| Immigrants | Hungary | 41.3 /100 | #181 | Average 5.5% |
| Immigrants | Sudan | 40.6 /100 | #182 | Average 5.5% |
| Immigrants | Laos | 38.8 /100 | #183 | Fair 5.5% |
| Immigrants | Cambodia | 38.4 /100 | #184 | Fair 5.5% |
Demographics Similar to Bolivians by Unemployment Among Women with Children Under 18 years
In terms of unemployment among women with children under 18 years, the demographic groups most similar to Bolivians are Immigrants from Lithuania (5.2%, a difference of 0.040%), Immigrants from Croatia (5.1%, a difference of 0.050%), Assyrian/Chaldean/Syriac (5.1%, a difference of 0.070%), Romanian (5.2%, a difference of 0.080%), and Zimbabwean (5.1%, a difference of 0.090%).
| Demographics | Rating | Rank | Unemployment Among Women with Children Under 18 years |
| Albanians | 95.9 /100 | #73 | Exceptional 5.1% |
| Immigrants | Northern Europe | 95.9 /100 | #74 | Exceptional 5.1% |
| Immigrants | Asia | 95.8 /100 | #75 | Exceptional 5.1% |
| Puget Sound Salish | 95.8 /100 | #76 | Exceptional 5.1% |
| Zimbabweans | 95.7 /100 | #77 | Exceptional 5.1% |
| Assyrians/Chaldeans/Syriacs | 95.7 /100 | #78 | Exceptional 5.1% |
| Immigrants | Croatia | 95.6 /100 | #79 | Exceptional 5.1% |
| Bolivians | 95.5 /100 | #80 | Exceptional 5.1% |
| Immigrants | Lithuania | 95.4 /100 | #81 | Exceptional 5.2% |
| Romanians | 95.3 /100 | #82 | Exceptional 5.2% |
| Maltese | 95.1 /100 | #83 | Exceptional 5.2% |
| Australians | 95.1 /100 | #84 | Exceptional 5.2% |
| Paraguayans | 94.8 /100 | #85 | Exceptional 5.2% |
| Immigrants | Indonesia | 94.8 /100 | #86 | Exceptional 5.2% |
| Laotians | 94.7 /100 | #87 | Exceptional 5.2% |