Immigrants from Kazakhstan vs Immigrants from Ukraine Unemployment Among Women with Children Ages 6 to 17 years
COMPARE
Immigrants from Kazakhstan
Immigrants from Ukraine
Unemployment Among Women with Children Ages 6 to 17 years
Unemployment Among Women with Children Ages 6 to 17 years Comparison
Immigrants from Kazakhstan
Immigrants from Ukraine
9.1%
UNEMPLOYMENT AMONG WOMEN WITH CHILDREN AGES 6 TO 17 YEARS
25.3/ 100
METRIC RATING
194th/ 347
METRIC RANK
8.6%
UNEMPLOYMENT AMONG WOMEN WITH CHILDREN AGES 6 TO 17 YEARS
97.4/ 100
METRIC RATING
111th/ 347
METRIC RANK
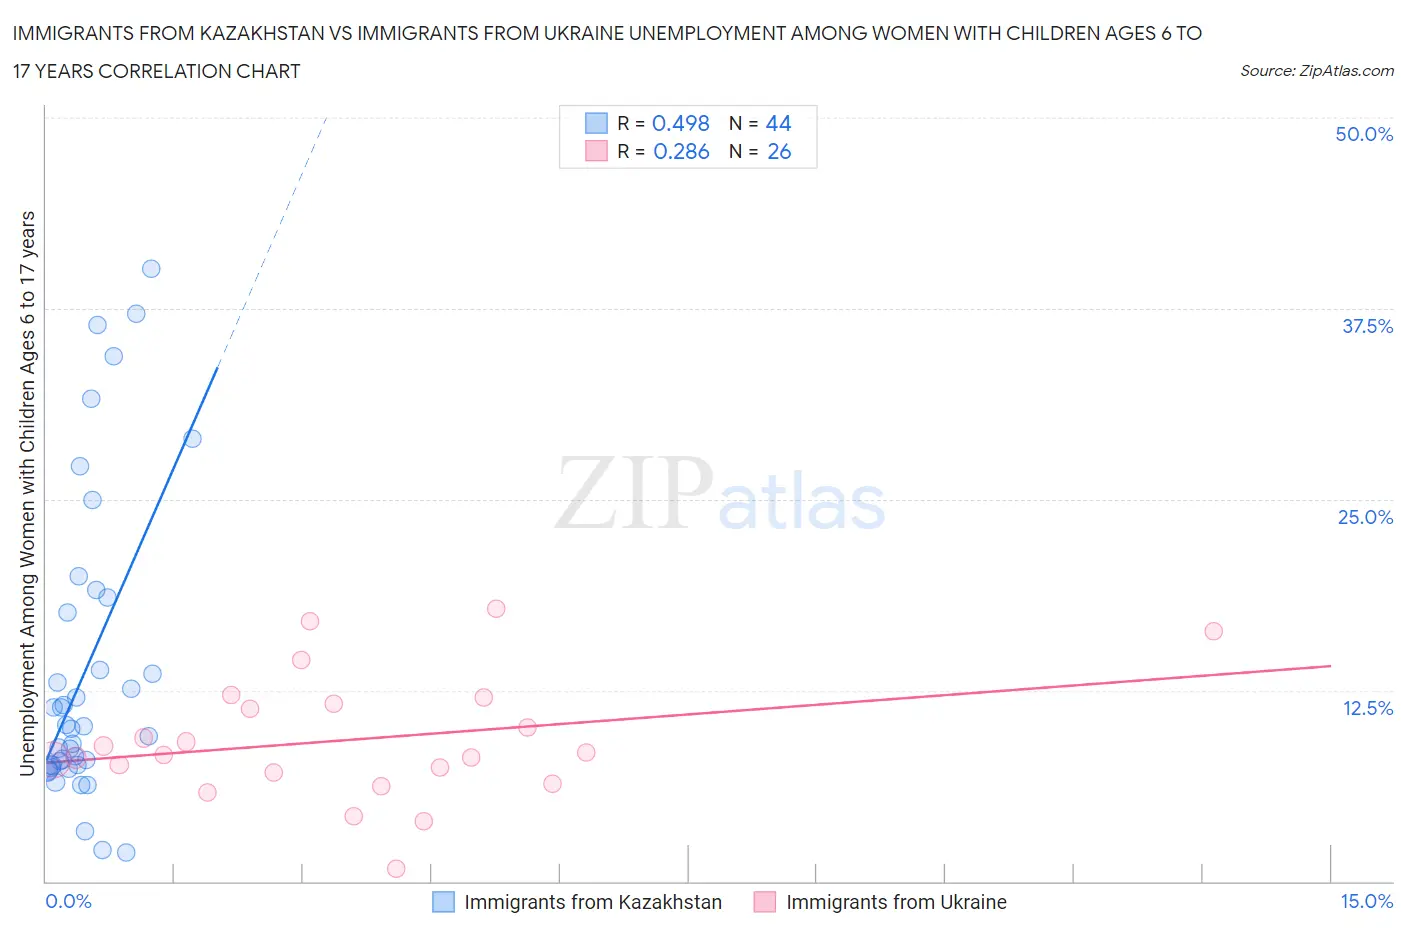
Immigrants from Kazakhstan vs Immigrants from Ukraine Unemployment Among Women with Children Ages 6 to 17 years Correlation Chart
The statistical analysis conducted on geographies consisting of 103,492,254 people shows a moderate positive correlation between the proportion of Immigrants from Kazakhstan and unemployment rate among women with children between the ages 6 and 17 in the United States with a correlation coefficient (R) of 0.498 and weighted average of 9.1%. Similarly, the statistical analysis conducted on geographies consisting of 215,687,583 people shows a weak positive correlation between the proportion of Immigrants from Ukraine and unemployment rate among women with children between the ages 6 and 17 in the United States with a correlation coefficient (R) of 0.286 and weighted average of 8.6%, a difference of 5.4%.
Unemployment Among Women with Children Ages 6 to 17 years Correlation Summary
| Measurement | Immigrants from Kazakhstan | Immigrants from Ukraine |
| Minimum | 1.9% | 0.80% |
| Maximum | 40.1% | 17.8% |
| Range | 38.2% | 17.0% |
| Mean | 13.9% | 9.3% |
| Median | 10.0% | 8.3% |
| Interquartile 25% (IQ1) | 7.6% | 7.1% |
| Interquartile 75% (IQ3) | 18.1% | 11.6% |
| Interquartile Range (IQR) | 10.5% | 4.5% |
| Standard Deviation (Sample) | 10.0% | 4.0% |
| Standard Deviation (Population) | 9.8% | 4.0% |
Similar Demographics by Unemployment Among Women with Children Ages 6 to 17 years
Demographics Similar to Immigrants from Kazakhstan by Unemployment Among Women with Children Ages 6 to 17 years
In terms of unemployment among women with children ages 6 to 17 years, the demographic groups most similar to Immigrants from Kazakhstan are Austrian (9.1%, a difference of 0.020%), Immigrants from Turkey (9.1%, a difference of 0.030%), Brazilian (9.1%, a difference of 0.050%), Immigrants from Panama (9.1%, a difference of 0.060%), and Guamanian/Chamorro (9.1%, a difference of 0.11%).
| Demographics | Rating | Rank | Unemployment Among Women with Children Ages 6 to 17 years |
| Comanche | 30.0 /100 | #187 | Fair 9.0% |
| Immigrants | Syria | 29.7 /100 | #188 | Fair 9.1% |
| Immigrants | Immigrants | 29.2 /100 | #189 | Fair 9.1% |
| Slovenes | 28.5 /100 | #190 | Fair 9.1% |
| Belizeans | 28.4 /100 | #191 | Fair 9.1% |
| Guamanians/Chamorros | 27.2 /100 | #192 | Fair 9.1% |
| Immigrants | Turkey | 25.8 /100 | #193 | Fair 9.1% |
| Immigrants | Kazakhstan | 25.3 /100 | #194 | Fair 9.1% |
| Austrians | 25.0 /100 | #195 | Fair 9.1% |
| Brazilians | 24.4 /100 | #196 | Fair 9.1% |
| Immigrants | Panama | 24.3 /100 | #197 | Fair 9.1% |
| Guyanese | 21.8 /100 | #198 | Fair 9.1% |
| Czechoslovakians | 20.8 /100 | #199 | Fair 9.1% |
| Trinidadians and Tobagonians | 18.2 /100 | #200 | Poor 9.1% |
| Immigrants | Trinidad and Tobago | 16.7 /100 | #201 | Poor 9.1% |
Demographics Similar to Immigrants from Ukraine by Unemployment Among Women with Children Ages 6 to 17 years
In terms of unemployment among women with children ages 6 to 17 years, the demographic groups most similar to Immigrants from Ukraine are Latvian (8.6%, a difference of 0.010%), Immigrants from Romania (8.6%, a difference of 0.020%), Swedish (8.6%, a difference of 0.090%), Chickasaw (8.6%, a difference of 0.10%), and Romanian (8.6%, a difference of 0.12%).
| Demographics | Rating | Rank | Unemployment Among Women with Children Ages 6 to 17 years |
| Immigrants | France | 98.0 /100 | #104 | Exceptional 8.6% |
| Immigrants | Norway | 97.8 /100 | #105 | Exceptional 8.6% |
| Immigrants | Serbia | 97.7 /100 | #106 | Exceptional 8.6% |
| Chickasaw | 97.6 /100 | #107 | Exceptional 8.6% |
| Swedes | 97.6 /100 | #108 | Exceptional 8.6% |
| Immigrants | Romania | 97.5 /100 | #109 | Exceptional 8.6% |
| Latvians | 97.4 /100 | #110 | Exceptional 8.6% |
| Immigrants | Ukraine | 97.4 /100 | #111 | Exceptional 8.6% |
| Romanians | 97.1 /100 | #112 | Exceptional 8.6% |
| Eastern Europeans | 96.8 /100 | #113 | Exceptional 8.6% |
| Immigrants | Russia | 96.7 /100 | #114 | Exceptional 8.6% |
| Argentineans | 96.5 /100 | #115 | Exceptional 8.6% |
| Zimbabweans | 96.3 /100 | #116 | Exceptional 8.6% |
| Albanians | 96.3 /100 | #117 | Exceptional 8.6% |
| Pueblo | 96.2 /100 | #118 | Exceptional 8.6% |