Immigrants from Jordan vs Scottish Unemployment Among Ages 55 to 59 years
COMPARE
Immigrants from Jordan
Scottish
Unemployment Among Ages 55 to 59 years
Unemployment Among Ages 55 to 59 years Comparison
Immigrants from Jordan
Scottish
4.6%
UNEMPLOYMENT AMONG AGES 55 TO 59 YEARS
98.7/ 100
METRIC RATING
71st/ 347
METRIC RANK
4.5%
UNEMPLOYMENT AMONG AGES 55 TO 59 YEARS
99.7/ 100
METRIC RATING
52nd/ 347
METRIC RANK
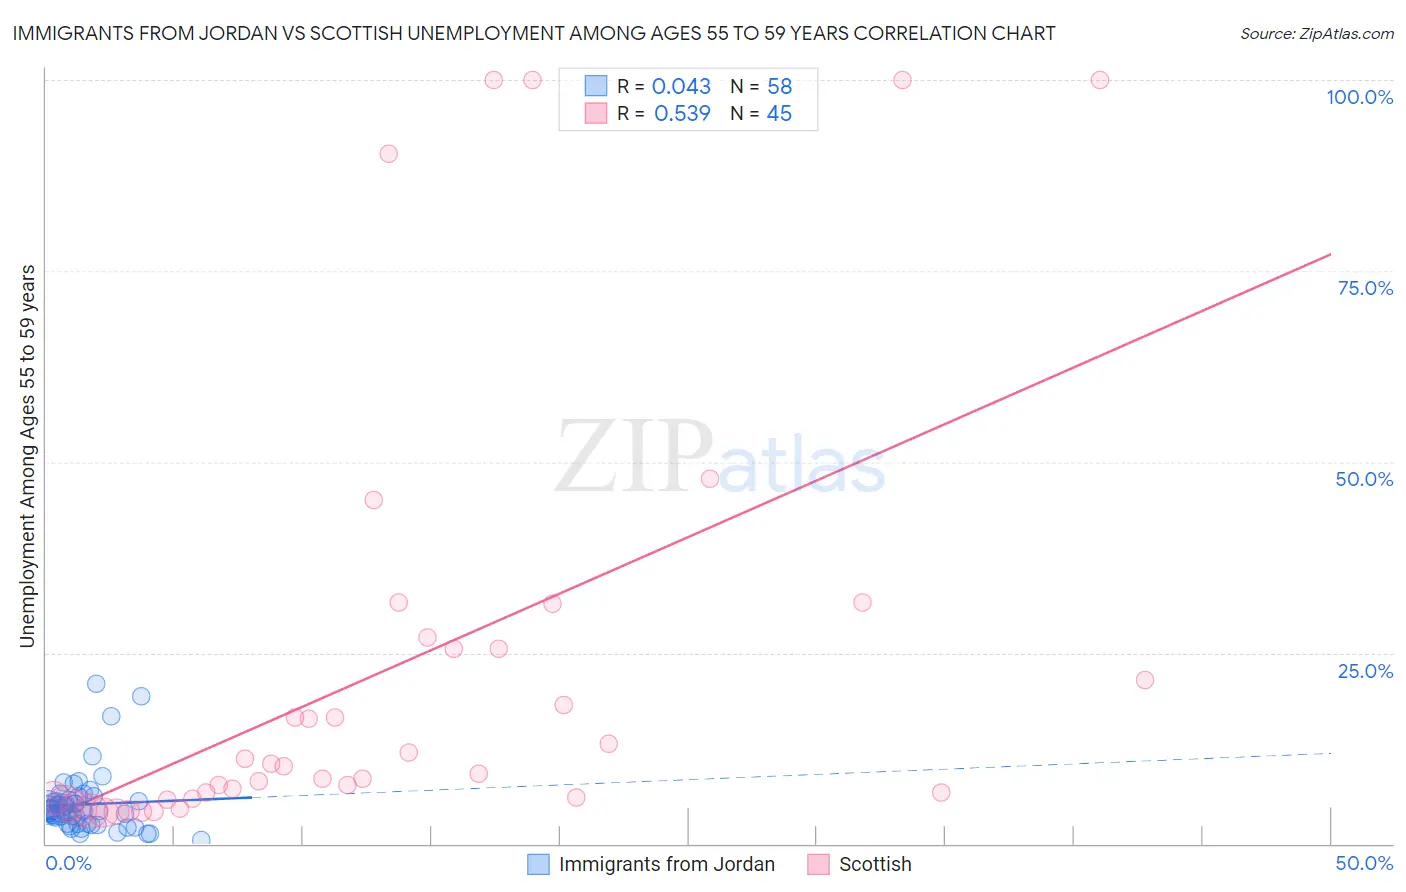
Immigrants from Jordan vs Scottish Unemployment Among Ages 55 to 59 years Correlation Chart
The statistical analysis conducted on geographies consisting of 176,295,369 people shows no correlation between the proportion of Immigrants from Jordan and unemployment rate among population between the ages 55 and 59 in the United States with a correlation coefficient (R) of 0.043 and weighted average of 4.6%. Similarly, the statistical analysis conducted on geographies consisting of 482,661,898 people shows a substantial positive correlation between the proportion of Scottish and unemployment rate among population between the ages 55 and 59 in the United States with a correlation coefficient (R) of 0.539 and weighted average of 4.5%, a difference of 1.5%.
Unemployment Among Ages 55 to 59 years Correlation Summary
| Measurement | Immigrants from Jordan | Scottish |
| Minimum | 0.50% | 4.1% |
| Maximum | 21.0% | 100.0% |
| Range | 20.5% | 95.9% |
| Mean | 5.1% | 23.0% |
| Median | 4.4% | 10.2% |
| Interquartile 25% (IQ1) | 2.6% | 5.9% |
| Interquartile 75% (IQ3) | 5.6% | 26.3% |
| Interquartile Range (IQR) | 3.0% | 20.4% |
| Standard Deviation (Sample) | 3.9% | 28.9% |
| Standard Deviation (Population) | 3.9% | 28.6% |
Demographics Similar to Immigrants from Jordan and Scottish by Unemployment Among Ages 55 to 59 years
In terms of unemployment among ages 55 to 59 years, the demographic groups most similar to Immigrants from Jordan are Filipino (4.6%, a difference of 0.030%), Czechoslovakian (4.6%, a difference of 0.23%), Immigrants from Micronesia (4.6%, a difference of 0.24%), Ugandan (4.6%, a difference of 0.25%), and Mongolian (4.6%, a difference of 0.28%). Similarly, the demographic groups most similar to Scottish are Immigrants from Middle Africa (4.5%, a difference of 0.010%), Burmese (4.5%, a difference of 0.010%), Immigrants from Nepal (4.5%, a difference of 0.10%), Maltese (4.5%, a difference of 0.11%), and Welsh (4.5%, a difference of 0.16%).
| Demographics | Rating | Rank | Unemployment Among Ages 55 to 59 years |
| Maltese | 99.7 /100 | #51 | Exceptional 4.5% |
| Scottish | 99.7 /100 | #52 | Exceptional 4.5% |
| Immigrants | Middle Africa | 99.7 /100 | #53 | Exceptional 4.5% |
| Burmese | 99.7 /100 | #54 | Exceptional 4.5% |
| Immigrants | Nepal | 99.6 /100 | #55 | Exceptional 4.5% |
| Welsh | 99.6 /100 | #56 | Exceptional 4.5% |
| Northern Europeans | 99.6 /100 | #57 | Exceptional 4.5% |
| Okinawans | 99.6 /100 | #58 | Exceptional 4.5% |
| Immigrants | Uganda | 99.5 /100 | #59 | Exceptional 4.6% |
| Dutch | 99.5 /100 | #60 | Exceptional 4.6% |
| Immigrants | Argentina | 99.5 /100 | #61 | Exceptional 4.6% |
| Slovenes | 99.3 /100 | #62 | Exceptional 4.6% |
| Immigrants | South Central Asia | 99.3 /100 | #63 | Exceptional 4.6% |
| Argentineans | 99.1 /100 | #64 | Exceptional 4.6% |
| Sudanese | 99.1 /100 | #65 | Exceptional 4.6% |
| Mongolians | 99.0 /100 | #66 | Exceptional 4.6% |
| Ugandans | 99.0 /100 | #67 | Exceptional 4.6% |
| Immigrants | Micronesia | 99.0 /100 | #68 | Exceptional 4.6% |
| Czechoslovakians | 99.0 /100 | #69 | Exceptional 4.6% |
| Filipinos | 98.8 /100 | #70 | Exceptional 4.6% |
| Immigrants | Jordan | 98.7 /100 | #71 | Exceptional 4.6% |