Immigrants from Japan vs Russian Unemployment Among Women with Children Under 18 years
COMPARE
Immigrants from Japan
Russian
Unemployment Among Women with Children Under 18 years
Unemployment Among Women with Children Under 18 years Comparison
Immigrants from Japan
Russians
5.0%
UNEMPLOYMENT AMONG WOMEN WITH CHILDREN UNDER 18 YEARS
98.4/ 100
METRIC RATING
50th/ 347
METRIC RANK
5.1%
UNEMPLOYMENT AMONG WOMEN WITH CHILDREN UNDER 18 YEARS
97.5/ 100
METRIC RATING
61st/ 347
METRIC RANK
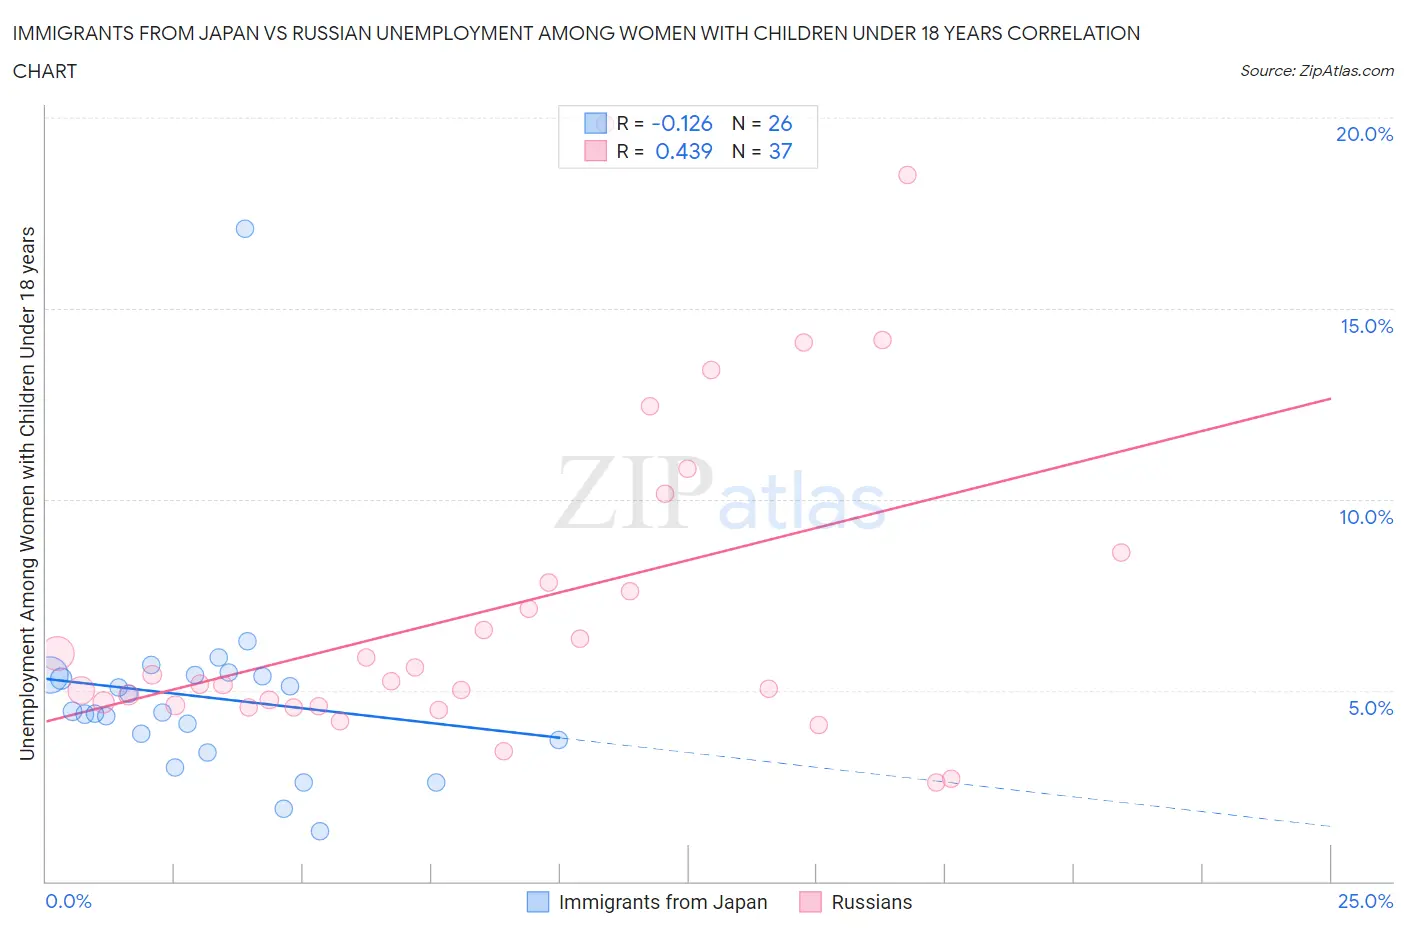
Immigrants from Japan vs Russian Unemployment Among Women with Children Under 18 years Correlation Chart
The statistical analysis conducted on geographies consisting of 329,595,310 people shows a poor negative correlation between the proportion of Immigrants from Japan and unemployment rate among women with children under the age of 18 in the United States with a correlation coefficient (R) of -0.126 and weighted average of 5.0%. Similarly, the statistical analysis conducted on geographies consisting of 475,239,030 people shows a moderate positive correlation between the proportion of Russians and unemployment rate among women with children under the age of 18 in the United States with a correlation coefficient (R) of 0.439 and weighted average of 5.1%, a difference of 0.83%.
Unemployment Among Women with Children Under 18 years Correlation Summary
| Measurement | Immigrants from Japan | Russian |
| Minimum | 1.3% | 2.6% |
| Maximum | 17.1% | 19.8% |
| Range | 15.8% | 17.2% |
| Mean | 4.8% | 7.2% |
| Median | 4.4% | 5.2% |
| Interquartile 25% (IQ1) | 3.7% | 4.6% |
| Interquartile 75% (IQ3) | 5.4% | 8.2% |
| Interquartile Range (IQR) | 1.7% | 3.6% |
| Standard Deviation (Sample) | 2.8% | 4.2% |
| Standard Deviation (Population) | 2.7% | 4.2% |
Demographics Similar to Immigrants from Japan and Russians by Unemployment Among Women with Children Under 18 years
In terms of unemployment among women with children under 18 years, the demographic groups most similar to Immigrants from Japan are Lithuanian (5.0%, a difference of 0.030%), Yugoslavian (5.1%, a difference of 0.080%), Immigrants from Nepal (5.1%, a difference of 0.080%), Scottish (5.1%, a difference of 0.17%), and Immigrants from Serbia (5.1%, a difference of 0.20%). Similarly, the demographic groups most similar to Russians are Immigrants from Bulgaria (5.1%, a difference of 0.070%), Italian (5.1%, a difference of 0.080%), Welsh (5.1%, a difference of 0.15%), Estonian (5.1%, a difference of 0.26%), and Immigrants from Sweden (5.1%, a difference of 0.28%).
| Demographics | Rating | Rank | Unemployment Among Women with Children Under 18 years |
| Immigrants | Malaysia | 98.8 /100 | #45 | Exceptional 5.0% |
| Immigrants | Korea | 98.7 /100 | #46 | Exceptional 5.0% |
| British | 98.7 /100 | #47 | Exceptional 5.0% |
| Northern Europeans | 98.6 /100 | #48 | Exceptional 5.0% |
| Lithuanians | 98.4 /100 | #49 | Exceptional 5.0% |
| Immigrants | Japan | 98.4 /100 | #50 | Exceptional 5.0% |
| Yugoslavians | 98.3 /100 | #51 | Exceptional 5.1% |
| Immigrants | Nepal | 98.3 /100 | #52 | Exceptional 5.1% |
| Scottish | 98.2 /100 | #53 | Exceptional 5.1% |
| Immigrants | Serbia | 98.2 /100 | #54 | Exceptional 5.1% |
| Immigrants | Sri Lanka | 98.1 /100 | #55 | Exceptional 5.1% |
| Immigrants | Ireland | 98.0 /100 | #56 | Exceptional 5.1% |
| Czechoslovakians | 98.0 /100 | #57 | Exceptional 5.1% |
| Immigrants | Belgium | 97.9 /100 | #58 | Exceptional 5.1% |
| Asians | 97.9 /100 | #59 | Exceptional 5.1% |
| Welsh | 97.7 /100 | #60 | Exceptional 5.1% |
| Russians | 97.5 /100 | #61 | Exceptional 5.1% |
| Immigrants | Bulgaria | 97.4 /100 | #62 | Exceptional 5.1% |
| Italians | 97.4 /100 | #63 | Exceptional 5.1% |
| Estonians | 97.2 /100 | #64 | Exceptional 5.1% |
| Immigrants | Sweden | 97.1 /100 | #65 | Exceptional 5.1% |