Bahamian vs Russian Unemployment Among Women with Children Under 18 years
COMPARE
Bahamian
Russian
Unemployment Among Women with Children Under 18 years
Unemployment Among Women with Children Under 18 years Comparison
Bahamians
Russians
6.3%
UNEMPLOYMENT AMONG WOMEN WITH CHILDREN UNDER 18 YEARS
0.0/ 100
METRIC RATING
285th/ 347
METRIC RANK
5.1%
UNEMPLOYMENT AMONG WOMEN WITH CHILDREN UNDER 18 YEARS
97.5/ 100
METRIC RATING
61st/ 347
METRIC RANK
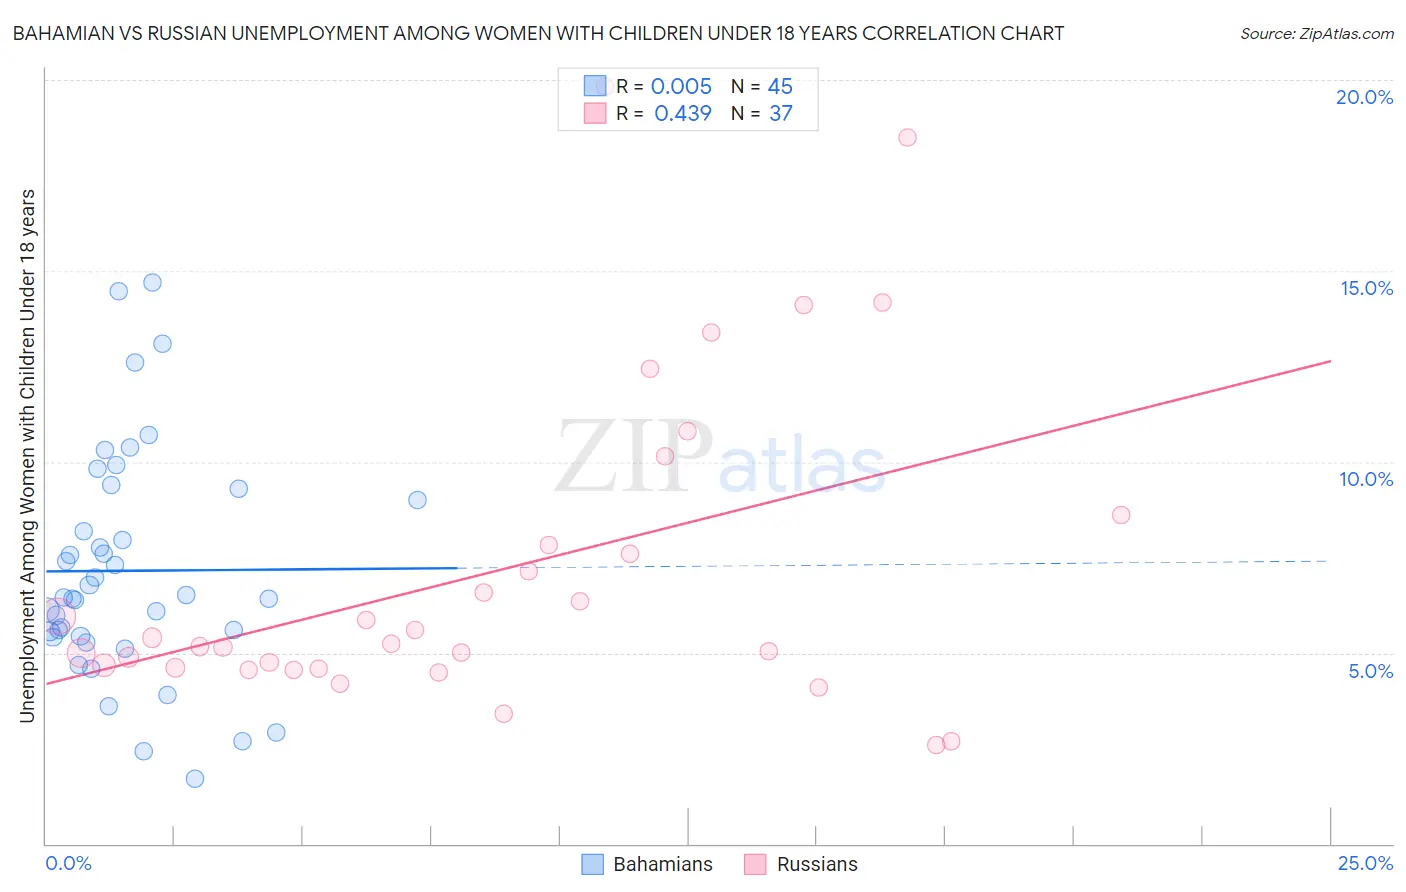
Bahamian vs Russian Unemployment Among Women with Children Under 18 years Correlation Chart
The statistical analysis conducted on geographies consisting of 110,895,720 people shows no correlation between the proportion of Bahamians and unemployment rate among women with children under the age of 18 in the United States with a correlation coefficient (R) of 0.005 and weighted average of 6.3%. Similarly, the statistical analysis conducted on geographies consisting of 475,239,030 people shows a moderate positive correlation between the proportion of Russians and unemployment rate among women with children under the age of 18 in the United States with a correlation coefficient (R) of 0.439 and weighted average of 5.1%, a difference of 24.2%.
Unemployment Among Women with Children Under 18 years Correlation Summary
| Measurement | Bahamian | Russian |
| Minimum | 1.7% | 2.6% |
| Maximum | 14.7% | 19.8% |
| Range | 13.0% | 17.2% |
| Mean | 7.1% | 7.2% |
| Median | 6.4% | 5.2% |
| Interquartile 25% (IQ1) | 5.4% | 4.6% |
| Interquartile 75% (IQ3) | 9.1% | 8.2% |
| Interquartile Range (IQR) | 3.7% | 3.6% |
| Standard Deviation (Sample) | 3.0% | 4.2% |
| Standard Deviation (Population) | 3.0% | 4.2% |
Similar Demographics by Unemployment Among Women with Children Under 18 years
Demographics Similar to Bahamians by Unemployment Among Women with Children Under 18 years
In terms of unemployment among women with children under 18 years, the demographic groups most similar to Bahamians are Immigrants from Grenada (6.3%, a difference of 0.15%), Alaskan Athabascan (6.3%, a difference of 0.15%), Kiowa (6.3%, a difference of 0.16%), West Indian (6.3%, a difference of 0.18%), and Cree (6.3%, a difference of 0.28%).
| Demographics | Rating | Rank | Unemployment Among Women with Children Under 18 years |
| Immigrants | Barbados | 0.0 /100 | #278 | Tragic 6.2% |
| Immigrants | Portugal | 0.0 /100 | #279 | Tragic 6.3% |
| Guatemalans | 0.0 /100 | #280 | Tragic 6.3% |
| Immigrants | El Salvador | 0.0 /100 | #281 | Tragic 6.3% |
| Immigrants | St. Vincent and the Grenadines | 0.0 /100 | #282 | Tragic 6.3% |
| West Indians | 0.0 /100 | #283 | Tragic 6.3% |
| Immigrants | Grenada | 0.0 /100 | #284 | Tragic 6.3% |
| Bahamians | 0.0 /100 | #285 | Tragic 6.3% |
| Alaskan Athabascans | 0.0 /100 | #286 | Tragic 6.3% |
| Kiowa | 0.0 /100 | #287 | Tragic 6.3% |
| Cree | 0.0 /100 | #288 | Tragic 6.3% |
| Immigrants | Caribbean | 0.0 /100 | #289 | Tragic 6.4% |
| Blackfeet | 0.0 /100 | #290 | Tragic 6.4% |
| Immigrants | Guatemala | 0.0 /100 | #291 | Tragic 6.4% |
| Mexicans | 0.0 /100 | #292 | Tragic 6.4% |
Demographics Similar to Russians by Unemployment Among Women with Children Under 18 years
In terms of unemployment among women with children under 18 years, the demographic groups most similar to Russians are Immigrants from Bulgaria (5.1%, a difference of 0.070%), Italian (5.1%, a difference of 0.080%), Welsh (5.1%, a difference of 0.15%), Estonian (5.1%, a difference of 0.26%), and Immigrants from Sweden (5.1%, a difference of 0.28%).
| Demographics | Rating | Rank | Unemployment Among Women with Children Under 18 years |
| Immigrants | Serbia | 98.2 /100 | #54 | Exceptional 5.1% |
| Immigrants | Sri Lanka | 98.1 /100 | #55 | Exceptional 5.1% |
| Immigrants | Ireland | 98.0 /100 | #56 | Exceptional 5.1% |
| Czechoslovakians | 98.0 /100 | #57 | Exceptional 5.1% |
| Immigrants | Belgium | 97.9 /100 | #58 | Exceptional 5.1% |
| Asians | 97.9 /100 | #59 | Exceptional 5.1% |
| Welsh | 97.7 /100 | #60 | Exceptional 5.1% |
| Russians | 97.5 /100 | #61 | Exceptional 5.1% |
| Immigrants | Bulgaria | 97.4 /100 | #62 | Exceptional 5.1% |
| Italians | 97.4 /100 | #63 | Exceptional 5.1% |
| Estonians | 97.2 /100 | #64 | Exceptional 5.1% |
| Immigrants | Sweden | 97.1 /100 | #65 | Exceptional 5.1% |
| Immigrants | Australia | 97.0 /100 | #66 | Exceptional 5.1% |
| Fijians | 96.9 /100 | #67 | Exceptional 5.1% |
| Irish | 96.8 /100 | #68 | Exceptional 5.1% |