Immigrants from Japan vs Iraqi Male Unemployment
COMPARE
Immigrants from Japan
Iraqi
Male Unemployment
Male Unemployment Comparison
Immigrants from Japan
Iraqis
4.9%
MALE UNEMPLOYMENT
99.2/ 100
METRIC RATING
43rd/ 347
METRIC RANK
5.4%
MALE UNEMPLOYMENT
31.6/ 100
METRIC RATING
186th/ 347
METRIC RANK
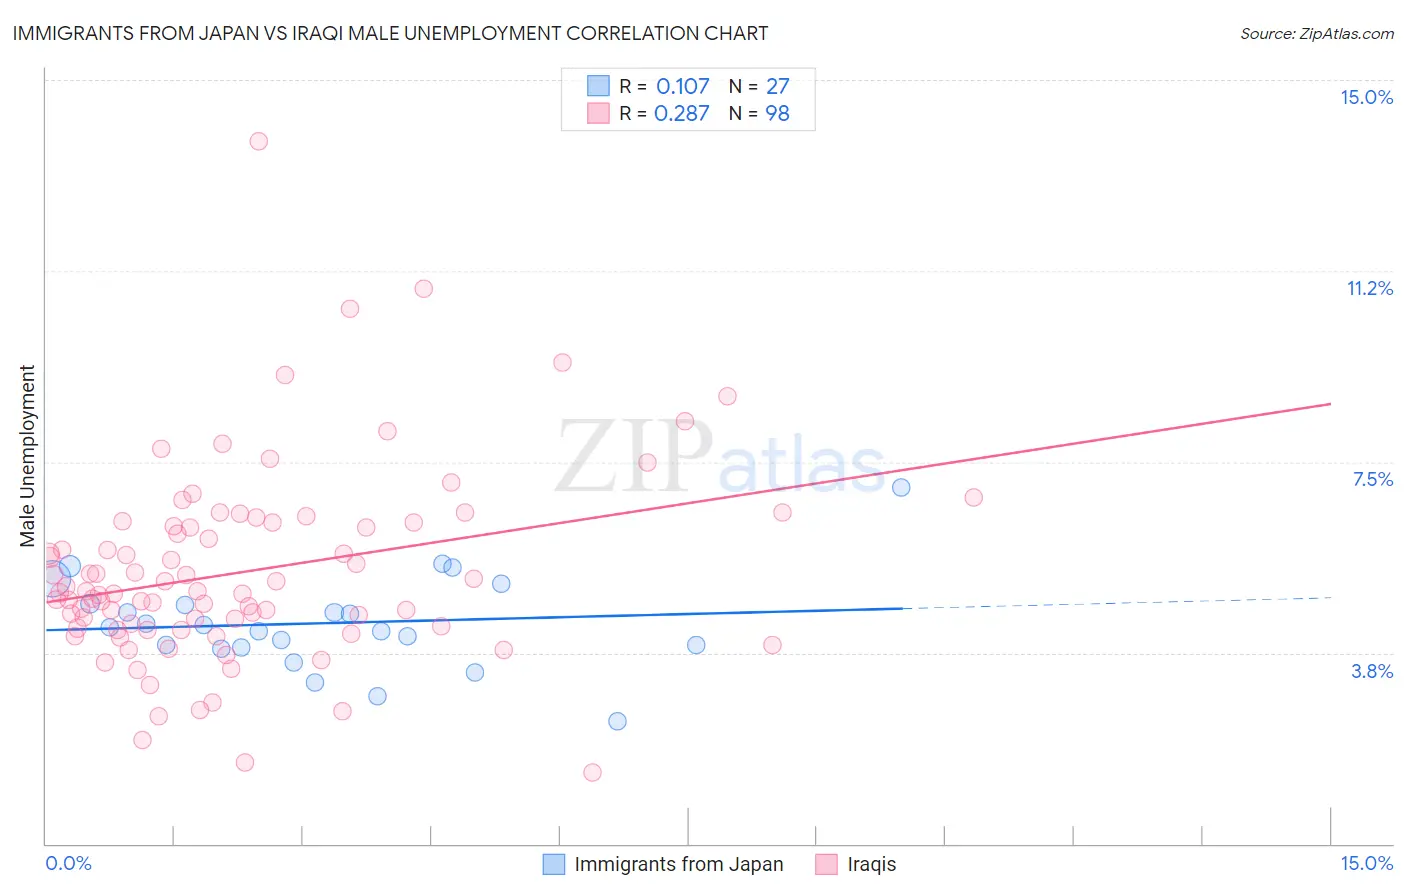
Immigrants from Japan vs Iraqi Male Unemployment Correlation Chart
The statistical analysis conducted on geographies consisting of 339,113,647 people shows a poor positive correlation between the proportion of Immigrants from Japan and unemployment rate among males in the United States with a correlation coefficient (R) of 0.107 and weighted average of 4.9%. Similarly, the statistical analysis conducted on geographies consisting of 170,532,331 people shows a weak positive correlation between the proportion of Iraqis and unemployment rate among males in the United States with a correlation coefficient (R) of 0.287 and weighted average of 5.4%, a difference of 8.8%.
Male Unemployment Correlation Summary
| Measurement | Immigrants from Japan | Iraqi |
| Minimum | 2.4% | 1.4% |
| Maximum | 7.0% | 13.8% |
| Range | 4.6% | 12.4% |
| Mean | 4.3% | 5.4% |
| Median | 4.3% | 4.9% |
| Interquartile 25% (IQ1) | 3.8% | 4.2% |
| Interquartile 75% (IQ3) | 4.7% | 6.3% |
| Interquartile Range (IQR) | 0.88% | 2.1% |
| Standard Deviation (Sample) | 0.93% | 1.9% |
| Standard Deviation (Population) | 0.91% | 1.9% |
Similar Demographics by Male Unemployment
Demographics Similar to Immigrants from Japan by Male Unemployment
In terms of male unemployment, the demographic groups most similar to Immigrants from Japan are Immigrants from Belgium (4.9%, a difference of 0.10%), Chinese (4.9%, a difference of 0.13%), Immigrants from Korea (4.9%, a difference of 0.18%), Northern European (4.9%, a difference of 0.21%), and Burmese (4.9%, a difference of 0.29%).
| Demographics | Rating | Rank | Male Unemployment |
| Immigrants | Singapore | 99.4 /100 | #36 | Exceptional 4.9% |
| Scotch-Irish | 99.4 /100 | #37 | Exceptional 4.9% |
| Immigrants | Bosnia and Herzegovina | 99.4 /100 | #38 | Exceptional 4.9% |
| Burmese | 99.3 /100 | #39 | Exceptional 4.9% |
| Northern Europeans | 99.3 /100 | #40 | Exceptional 4.9% |
| Chinese | 99.3 /100 | #41 | Exceptional 4.9% |
| Immigrants | Belgium | 99.2 /100 | #42 | Exceptional 4.9% |
| Immigrants | Japan | 99.2 /100 | #43 | Exceptional 4.9% |
| Immigrants | Korea | 99.1 /100 | #44 | Exceptional 4.9% |
| Immigrants | Zimbabwe | 99.0 /100 | #45 | Exceptional 4.9% |
| Bhutanese | 98.9 /100 | #46 | Exceptional 4.9% |
| Austrians | 98.9 /100 | #47 | Exceptional 4.9% |
| Immigrants | Scotland | 98.9 /100 | #48 | Exceptional 4.9% |
| Poles | 98.9 /100 | #49 | Exceptional 4.9% |
| Croatians | 98.9 /100 | #50 | Exceptional 4.9% |
Demographics Similar to Iraqis by Male Unemployment
In terms of male unemployment, the demographic groups most similar to Iraqis are Costa Rican (5.4%, a difference of 0.010%), Arab (5.4%, a difference of 0.090%), Immigrants from South America (5.4%, a difference of 0.15%), Immigrants from Uganda (5.4%, a difference of 0.19%), and Korean (5.3%, a difference of 0.22%).
| Demographics | Rating | Rank | Male Unemployment |
| Immigrants | Oceania | 40.8 /100 | #179 | Average 5.3% |
| Malaysians | 39.6 /100 | #180 | Fair 5.3% |
| Immigrants | Afghanistan | 37.9 /100 | #181 | Fair 5.3% |
| Potawatomi | 37.8 /100 | #182 | Fair 5.3% |
| Taiwanese | 37.6 /100 | #183 | Fair 5.3% |
| Spaniards | 35.1 /100 | #184 | Fair 5.3% |
| Koreans | 34.9 /100 | #185 | Fair 5.3% |
| Iraqis | 31.6 /100 | #186 | Fair 5.4% |
| Costa Ricans | 31.3 /100 | #187 | Fair 5.4% |
| Arabs | 30.2 /100 | #188 | Fair 5.4% |
| Immigrants | South America | 29.4 /100 | #189 | Fair 5.4% |
| Immigrants | Uganda | 28.8 /100 | #190 | Fair 5.4% |
| Immigrants | South Eastern Asia | 28.2 /100 | #191 | Fair 5.4% |
| Immigrants | Belarus | 26.0 /100 | #192 | Fair 5.4% |
| Immigrants | Israel | 25.2 /100 | #193 | Fair 5.4% |