Immigrants from Japan vs Alaskan Athabascan Male Unemployment
COMPARE
Immigrants from Japan
Alaskan Athabascan
Male Unemployment
Male Unemployment Comparison
Immigrants from Japan
Alaskan Athabascans
4.9%
MALE UNEMPLOYMENT
99.2/ 100
METRIC RATING
43rd/ 347
METRIC RANK
9.8%
MALE UNEMPLOYMENT
0.0/ 100
METRIC RATING
340th/ 347
METRIC RANK
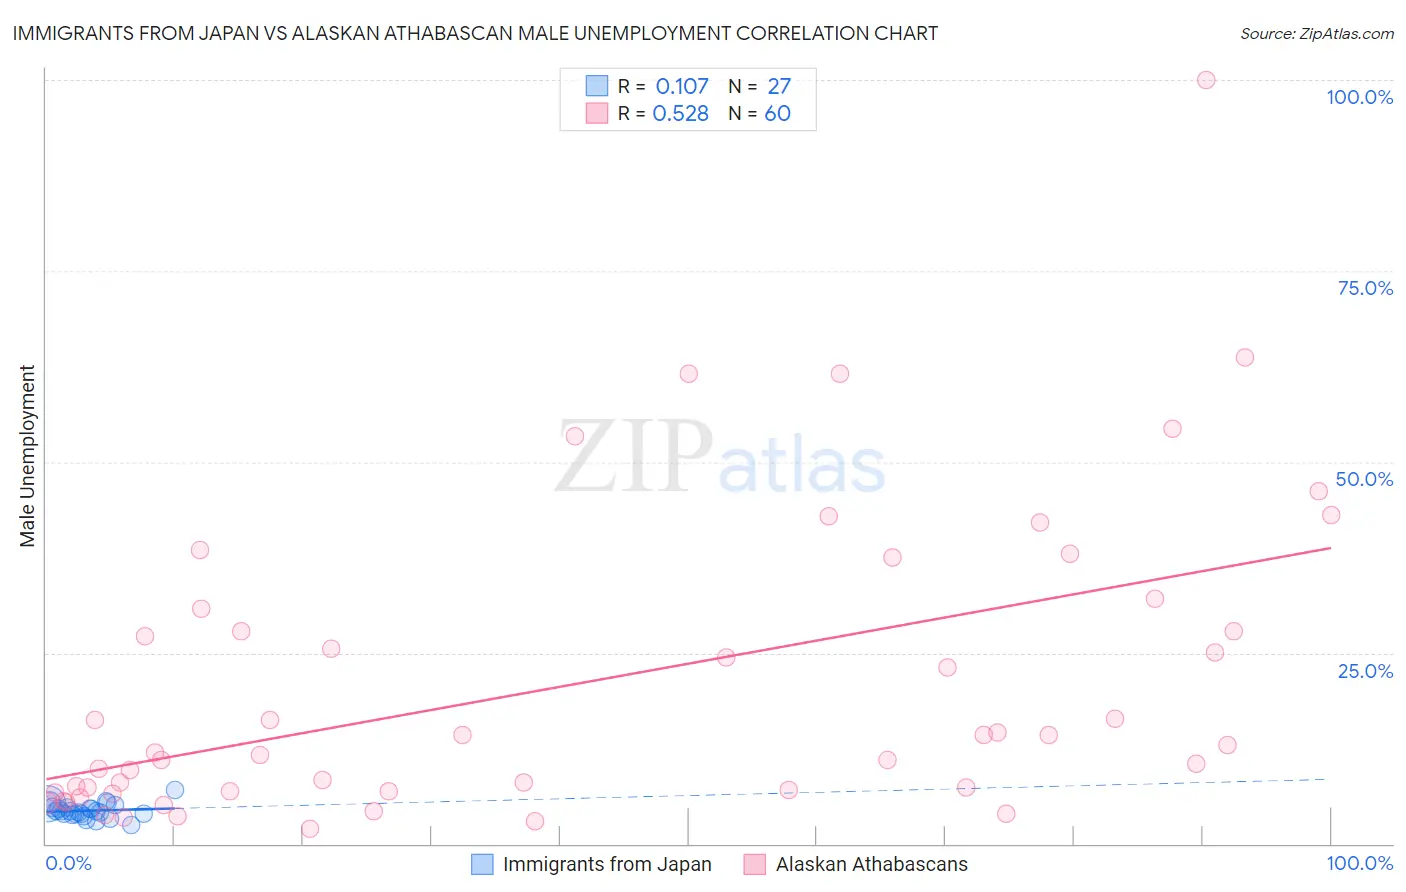
Immigrants from Japan vs Alaskan Athabascan Male Unemployment Correlation Chart
The statistical analysis conducted on geographies consisting of 339,113,647 people shows a poor positive correlation between the proportion of Immigrants from Japan and unemployment rate among males in the United States with a correlation coefficient (R) of 0.107 and weighted average of 4.9%. Similarly, the statistical analysis conducted on geographies consisting of 45,763,974 people shows a substantial positive correlation between the proportion of Alaskan Athabascans and unemployment rate among males in the United States with a correlation coefficient (R) of 0.528 and weighted average of 9.8%, a difference of 99.1%.
Male Unemployment Correlation Summary
| Measurement | Immigrants from Japan | Alaskan Athabascan |
| Minimum | 2.4% | 2.0% |
| Maximum | 7.0% | 100.0% |
| Range | 4.6% | 98.0% |
| Mean | 4.3% | 20.9% |
| Median | 4.3% | 12.5% |
| Interquartile 25% (IQ1) | 3.8% | 6.8% |
| Interquartile 75% (IQ3) | 4.7% | 29.4% |
| Interquartile Range (IQR) | 0.88% | 22.5% |
| Standard Deviation (Sample) | 0.93% | 19.9% |
| Standard Deviation (Population) | 0.91% | 19.7% |
Similar Demographics by Male Unemployment
Demographics Similar to Immigrants from Japan by Male Unemployment
In terms of male unemployment, the demographic groups most similar to Immigrants from Japan are Immigrants from Belgium (4.9%, a difference of 0.10%), Chinese (4.9%, a difference of 0.13%), Immigrants from Korea (4.9%, a difference of 0.18%), Northern European (4.9%, a difference of 0.21%), and Burmese (4.9%, a difference of 0.29%).
| Demographics | Rating | Rank | Male Unemployment |
| Immigrants | Singapore | 99.4 /100 | #36 | Exceptional 4.9% |
| Scotch-Irish | 99.4 /100 | #37 | Exceptional 4.9% |
| Immigrants | Bosnia and Herzegovina | 99.4 /100 | #38 | Exceptional 4.9% |
| Burmese | 99.3 /100 | #39 | Exceptional 4.9% |
| Northern Europeans | 99.3 /100 | #40 | Exceptional 4.9% |
| Chinese | 99.3 /100 | #41 | Exceptional 4.9% |
| Immigrants | Belgium | 99.2 /100 | #42 | Exceptional 4.9% |
| Immigrants | Japan | 99.2 /100 | #43 | Exceptional 4.9% |
| Immigrants | Korea | 99.1 /100 | #44 | Exceptional 4.9% |
| Immigrants | Zimbabwe | 99.0 /100 | #45 | Exceptional 4.9% |
| Bhutanese | 98.9 /100 | #46 | Exceptional 4.9% |
| Austrians | 98.9 /100 | #47 | Exceptional 4.9% |
| Immigrants | Scotland | 98.9 /100 | #48 | Exceptional 4.9% |
| Poles | 98.9 /100 | #49 | Exceptional 4.9% |
| Croatians | 98.9 /100 | #50 | Exceptional 4.9% |
Demographics Similar to Alaskan Athabascans by Male Unemployment
In terms of male unemployment, the demographic groups most similar to Alaskan Athabascans are Cheyenne (9.8%, a difference of 0.080%), Navajo (9.8%, a difference of 0.28%), Tohono O'odham (10.2%, a difference of 3.7%), Crow (10.6%, a difference of 8.2%), and Hopi (10.8%, a difference of 10.0%).
| Demographics | Rating | Rank | Male Unemployment |
| Sioux | 0.0 /100 | #333 | Tragic 8.4% |
| Tsimshian | 0.0 /100 | #334 | Tragic 8.5% |
| Pueblo | 0.0 /100 | #335 | Tragic 8.5% |
| Yuman | 0.0 /100 | #336 | Tragic 8.6% |
| Puerto Ricans | 0.0 /100 | #337 | Tragic 8.6% |
| Apache | 0.0 /100 | #338 | Tragic 8.6% |
| Cheyenne | 0.0 /100 | #339 | Tragic 9.8% |
| Alaskan Athabascans | 0.0 /100 | #340 | Tragic 9.8% |
| Navajo | 0.0 /100 | #341 | Tragic 9.8% |
| Tohono O'odham | 0.0 /100 | #342 | Tragic 10.2% |
| Crow | 0.0 /100 | #343 | Tragic 10.6% |
| Hopi | 0.0 /100 | #344 | Tragic 10.8% |
| Arapaho | 0.0 /100 | #345 | Tragic 11.0% |
| Inupiat | 0.0 /100 | #346 | Tragic 12.1% |
| Yup'ik | 0.0 /100 | #347 | Tragic 16.4% |