Immigrants from Jamaica vs Kenyan Unemployment Among Women with Children Under 6 years
COMPARE
Immigrants from Jamaica
Kenyan
Unemployment Among Women with Children Under 6 years
Unemployment Among Women with Children Under 6 years Comparison
Immigrants from Jamaica
Kenyans
8.9%
UNEMPLOYMENT AMONG WOMEN WITH CHILDREN UNDER 6 YEARS
0.0/ 100
METRIC RATING
299th/ 347
METRIC RANK
7.6%
UNEMPLOYMENT AMONG WOMEN WITH CHILDREN UNDER 6 YEARS
62.5/ 100
METRIC RATING
167th/ 347
METRIC RANK
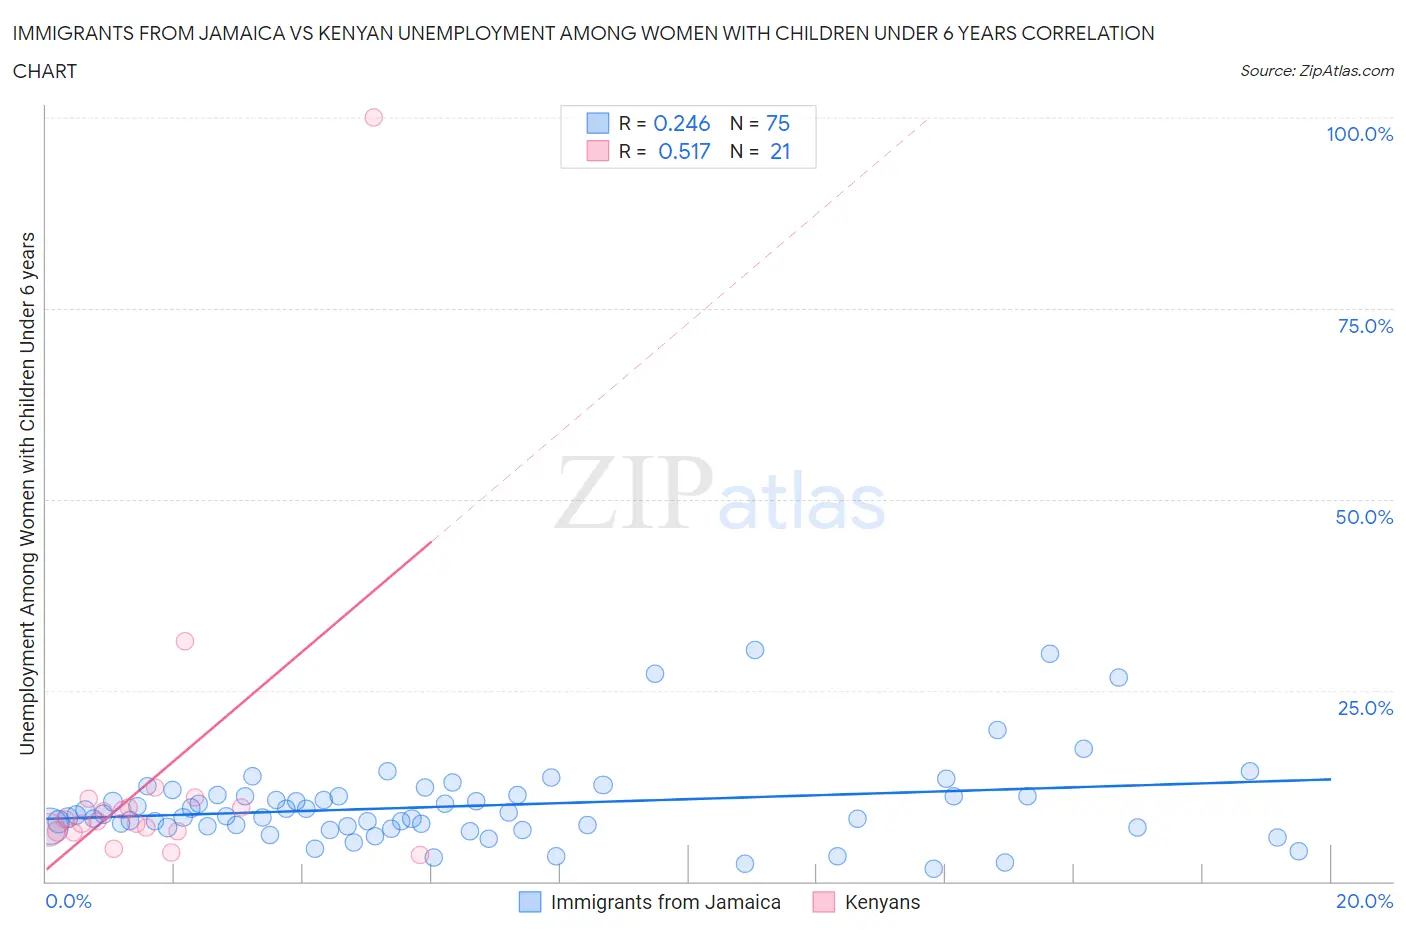
Immigrants from Jamaica vs Kenyan Unemployment Among Women with Children Under 6 years Correlation Chart
The statistical analysis conducted on geographies consisting of 242,447,417 people shows a weak positive correlation between the proportion of Immigrants from Jamaica and unemployment rate among women with children under the age of 6 in the United States with a correlation coefficient (R) of 0.246 and weighted average of 8.9%. Similarly, the statistical analysis conducted on geographies consisting of 147,179,108 people shows a substantial positive correlation between the proportion of Kenyans and unemployment rate among women with children under the age of 6 in the United States with a correlation coefficient (R) of 0.517 and weighted average of 7.6%, a difference of 17.5%.
Unemployment Among Women with Children Under 6 years Correlation Summary
| Measurement | Immigrants from Jamaica | Kenyan |
| Minimum | 1.7% | 3.5% |
| Maximum | 30.2% | 100.0% |
| Range | 28.5% | 96.5% |
| Mean | 9.9% | 13.3% |
| Median | 8.5% | 7.9% |
| Interquartile 25% (IQ1) | 7.1% | 6.5% |
| Interquartile 75% (IQ3) | 11.2% | 10.2% |
| Interquartile Range (IQR) | 4.1% | 3.8% |
| Standard Deviation (Sample) | 5.6% | 20.6% |
| Standard Deviation (Population) | 5.5% | 20.2% |
Similar Demographics by Unemployment Among Women with Children Under 6 years
Demographics Similar to Immigrants from Jamaica by Unemployment Among Women with Children Under 6 years
In terms of unemployment among women with children under 6 years, the demographic groups most similar to Immigrants from Jamaica are Creek (8.9%, a difference of 0.090%), Tlingit-Haida (8.9%, a difference of 0.21%), Mexican (8.9%, a difference of 0.37%), Immigrants from Dominican Republic (8.9%, a difference of 0.46%), and Immigrants from Central America (8.9%, a difference of 0.59%).
| Demographics | Rating | Rank | Unemployment Among Women with Children Under 6 years |
| Cheyenne | 0.0 /100 | #292 | Tragic 8.8% |
| Immigrants | Bangladesh | 0.0 /100 | #293 | Tragic 8.8% |
| Immigrants | Nonimmigrants | 0.0 /100 | #294 | Tragic 8.8% |
| Immigrants | Central America | 0.0 /100 | #295 | Tragic 8.9% |
| Immigrants | Dominican Republic | 0.0 /100 | #296 | Tragic 8.9% |
| Mexicans | 0.0 /100 | #297 | Tragic 8.9% |
| Tlingit-Haida | 0.0 /100 | #298 | Tragic 8.9% |
| Immigrants | Jamaica | 0.0 /100 | #299 | Tragic 8.9% |
| Creek | 0.0 /100 | #300 | Tragic 8.9% |
| Chickasaw | 0.0 /100 | #301 | Tragic 9.0% |
| Hispanics or Latinos | 0.0 /100 | #302 | Tragic 9.0% |
| Immigrants | West Indies | 0.0 /100 | #303 | Tragic 9.0% |
| Immigrants | Mexico | 0.0 /100 | #304 | Tragic 9.1% |
| Alaskan Athabascans | 0.0 /100 | #305 | Tragic 9.1% |
| Pueblo | 0.0 /100 | #306 | Tragic 9.1% |
Demographics Similar to Kenyans by Unemployment Among Women with Children Under 6 years
In terms of unemployment among women with children under 6 years, the demographic groups most similar to Kenyans are Belgian (7.6%, a difference of 0.070%), Immigrants from Canada (7.6%, a difference of 0.070%), Immigrants from Scotland (7.6%, a difference of 0.080%), Czech (7.6%, a difference of 0.19%), and Immigrants from South America (7.6%, a difference of 0.22%).
| Demographics | Rating | Rank | Unemployment Among Women with Children Under 6 years |
| Bolivians | 70.8 /100 | #160 | Good 7.5% |
| Immigrants | Western Asia | 70.2 /100 | #161 | Good 7.5% |
| Immigrants | Lithuania | 68.8 /100 | #162 | Good 7.5% |
| British | 66.3 /100 | #163 | Good 7.6% |
| Ugandans | 65.8 /100 | #164 | Good 7.6% |
| Immigrants | South America | 65.6 /100 | #165 | Good 7.6% |
| Belgians | 63.5 /100 | #166 | Good 7.6% |
| Kenyans | 62.5 /100 | #167 | Good 7.6% |
| Immigrants | Canada | 61.6 /100 | #168 | Good 7.6% |
| Immigrants | Scotland | 61.3 /100 | #169 | Good 7.6% |
| Czechs | 59.8 /100 | #170 | Average 7.6% |
| Immigrants | Grenada | 59.0 /100 | #171 | Average 7.6% |
| Immigrants | North America | 57.7 /100 | #172 | Average 7.6% |
| Cree | 51.6 /100 | #173 | Average 7.6% |
| Immigrants | Laos | 50.0 /100 | #174 | Average 7.6% |