Immigrants from Bosnia and Herzegovina vs Kenyan Unemployment Among Women with Children Under 6 years
COMPARE
Immigrants from Bosnia and Herzegovina
Kenyan
Unemployment Among Women with Children Under 6 years
Unemployment Among Women with Children Under 6 years Comparison
Immigrants from Bosnia and Herzegovina
Kenyans
7.3%
UNEMPLOYMENT AMONG WOMEN WITH CHILDREN UNDER 6 YEARS
93.5/ 100
METRIC RATING
122nd/ 347
METRIC RANK
7.6%
UNEMPLOYMENT AMONG WOMEN WITH CHILDREN UNDER 6 YEARS
62.5/ 100
METRIC RATING
167th/ 347
METRIC RANK
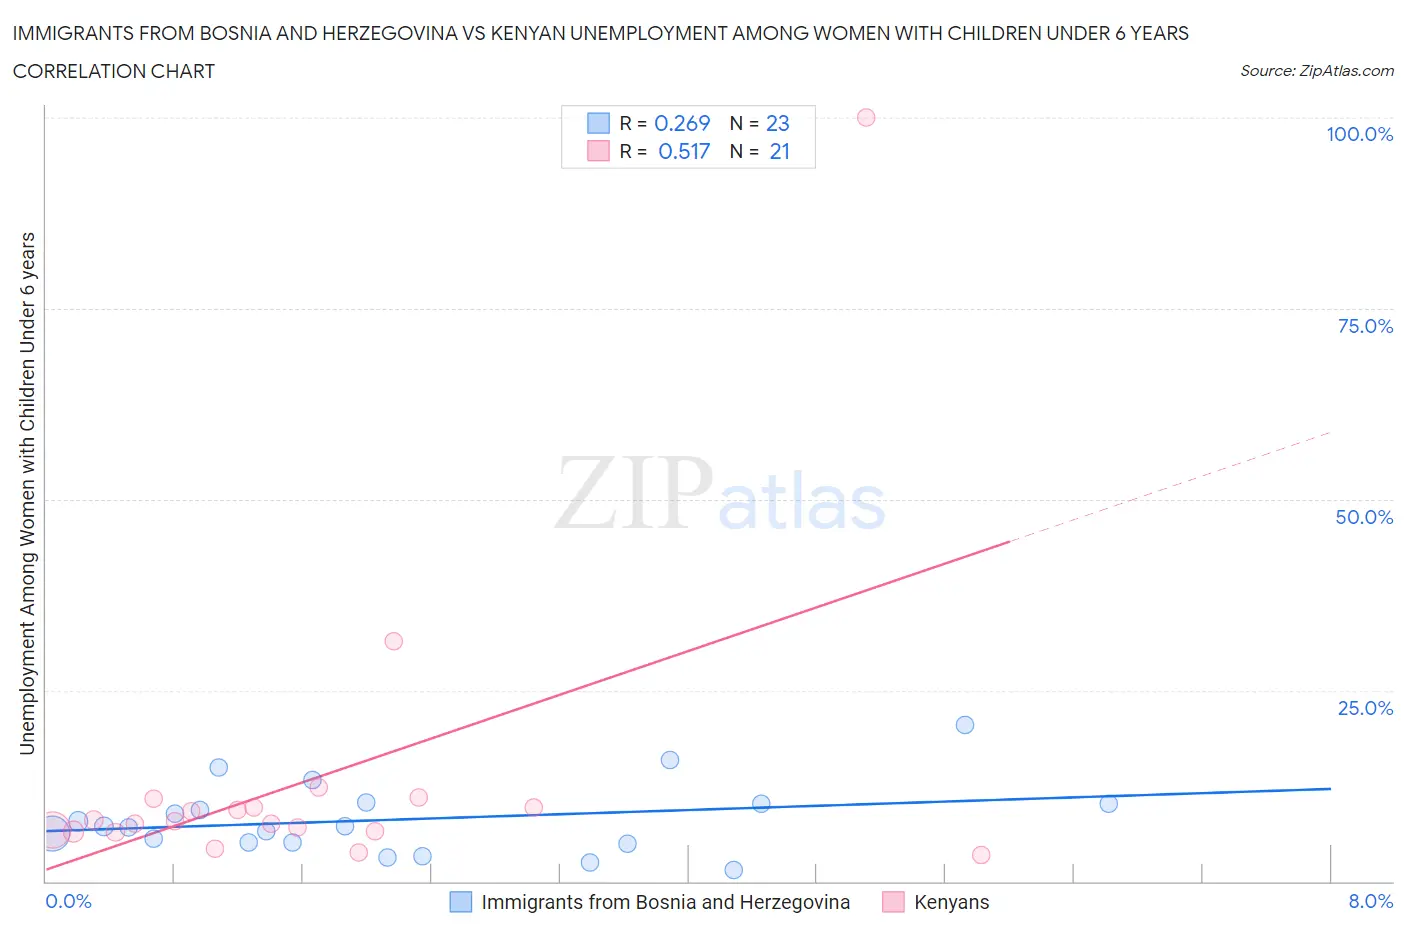
Immigrants from Bosnia and Herzegovina vs Kenyan Unemployment Among Women with Children Under 6 years Correlation Chart
The statistical analysis conducted on geographies consisting of 133,857,807 people shows a weak positive correlation between the proportion of Immigrants from Bosnia and Herzegovina and unemployment rate among women with children under the age of 6 in the United States with a correlation coefficient (R) of 0.269 and weighted average of 7.3%. Similarly, the statistical analysis conducted on geographies consisting of 147,179,108 people shows a substantial positive correlation between the proportion of Kenyans and unemployment rate among women with children under the age of 6 in the United States with a correlation coefficient (R) of 0.517 and weighted average of 7.6%, a difference of 3.7%.
Unemployment Among Women with Children Under 6 years Correlation Summary
| Measurement | Immigrants from Bosnia and Herzegovina | Kenyan |
| Minimum | 1.4% | 3.5% |
| Maximum | 20.5% | 100.0% |
| Range | 19.1% | 96.5% |
| Mean | 8.1% | 13.3% |
| Median | 7.1% | 7.9% |
| Interquartile 25% (IQ1) | 5.0% | 6.5% |
| Interquartile 75% (IQ3) | 10.2% | 10.2% |
| Interquartile Range (IQR) | 5.2% | 3.8% |
| Standard Deviation (Sample) | 4.6% | 20.6% |
| Standard Deviation (Population) | 4.5% | 20.2% |
Similar Demographics by Unemployment Among Women with Children Under 6 years
Demographics Similar to Immigrants from Bosnia and Herzegovina by Unemployment Among Women with Children Under 6 years
In terms of unemployment among women with children under 6 years, the demographic groups most similar to Immigrants from Bosnia and Herzegovina are Immigrants from Chile (7.3%, a difference of 0.010%), Immigrants from Zaire (7.3%, a difference of 0.050%), Iraqi (7.3%, a difference of 0.13%), South African (7.3%, a difference of 0.20%), and Immigrants from South Africa (7.3%, a difference of 0.25%).
| Demographics | Rating | Rank | Unemployment Among Women with Children Under 6 years |
| Immigrants | Italy | 96.1 /100 | #115 | Exceptional 7.2% |
| Armenians | 95.9 /100 | #116 | Exceptional 7.2% |
| Immigrants | Kenya | 95.4 /100 | #117 | Exceptional 7.3% |
| Serbians | 94.5 /100 | #118 | Exceptional 7.3% |
| South Africans | 94.1 /100 | #119 | Exceptional 7.3% |
| Iraqis | 93.9 /100 | #120 | Exceptional 7.3% |
| Immigrants | Chile | 93.5 /100 | #121 | Exceptional 7.3% |
| Immigrants | Bosnia and Herzegovina | 93.5 /100 | #122 | Exceptional 7.3% |
| Immigrants | Zaire | 93.3 /100 | #123 | Exceptional 7.3% |
| Immigrants | South Africa | 92.5 /100 | #124 | Exceptional 7.3% |
| Pakistanis | 92.2 /100 | #125 | Exceptional 7.3% |
| Immigrants | Burma/Myanmar | 91.9 /100 | #126 | Exceptional 7.3% |
| Jordanians | 91.5 /100 | #127 | Exceptional 7.3% |
| Zimbabweans | 91.5 /100 | #128 | Exceptional 7.3% |
| Slovenes | 89.2 /100 | #129 | Excellent 7.4% |
Demographics Similar to Kenyans by Unemployment Among Women with Children Under 6 years
In terms of unemployment among women with children under 6 years, the demographic groups most similar to Kenyans are Belgian (7.6%, a difference of 0.070%), Immigrants from Canada (7.6%, a difference of 0.070%), Immigrants from Scotland (7.6%, a difference of 0.080%), Czech (7.6%, a difference of 0.19%), and Immigrants from South America (7.6%, a difference of 0.22%).
| Demographics | Rating | Rank | Unemployment Among Women with Children Under 6 years |
| Bolivians | 70.8 /100 | #160 | Good 7.5% |
| Immigrants | Western Asia | 70.2 /100 | #161 | Good 7.5% |
| Immigrants | Lithuania | 68.8 /100 | #162 | Good 7.5% |
| British | 66.3 /100 | #163 | Good 7.6% |
| Ugandans | 65.8 /100 | #164 | Good 7.6% |
| Immigrants | South America | 65.6 /100 | #165 | Good 7.6% |
| Belgians | 63.5 /100 | #166 | Good 7.6% |
| Kenyans | 62.5 /100 | #167 | Good 7.6% |
| Immigrants | Canada | 61.6 /100 | #168 | Good 7.6% |
| Immigrants | Scotland | 61.3 /100 | #169 | Good 7.6% |
| Czechs | 59.8 /100 | #170 | Average 7.6% |
| Immigrants | Grenada | 59.0 /100 | #171 | Average 7.6% |
| Immigrants | North America | 57.7 /100 | #172 | Average 7.6% |
| Cree | 51.6 /100 | #173 | Average 7.6% |
| Immigrants | Laos | 50.0 /100 | #174 | Average 7.6% |