Immigrants from Italy vs Yaqui Unemployment Among Ages 60 to 64 years
COMPARE
Immigrants from Italy
Yaqui
Unemployment Among Ages 60 to 64 years
Unemployment Among Ages 60 to 64 years Comparison
Immigrants from Italy
Yaqui
4.8%
UNEMPLOYMENT AMONG AGES 60 TO 64 YEARS
78.7/ 100
METRIC RATING
150th/ 347
METRIC RANK
4.8%
UNEMPLOYMENT AMONG AGES 60 TO 64 YEARS
89.5/ 100
METRIC RATING
133rd/ 347
METRIC RANK
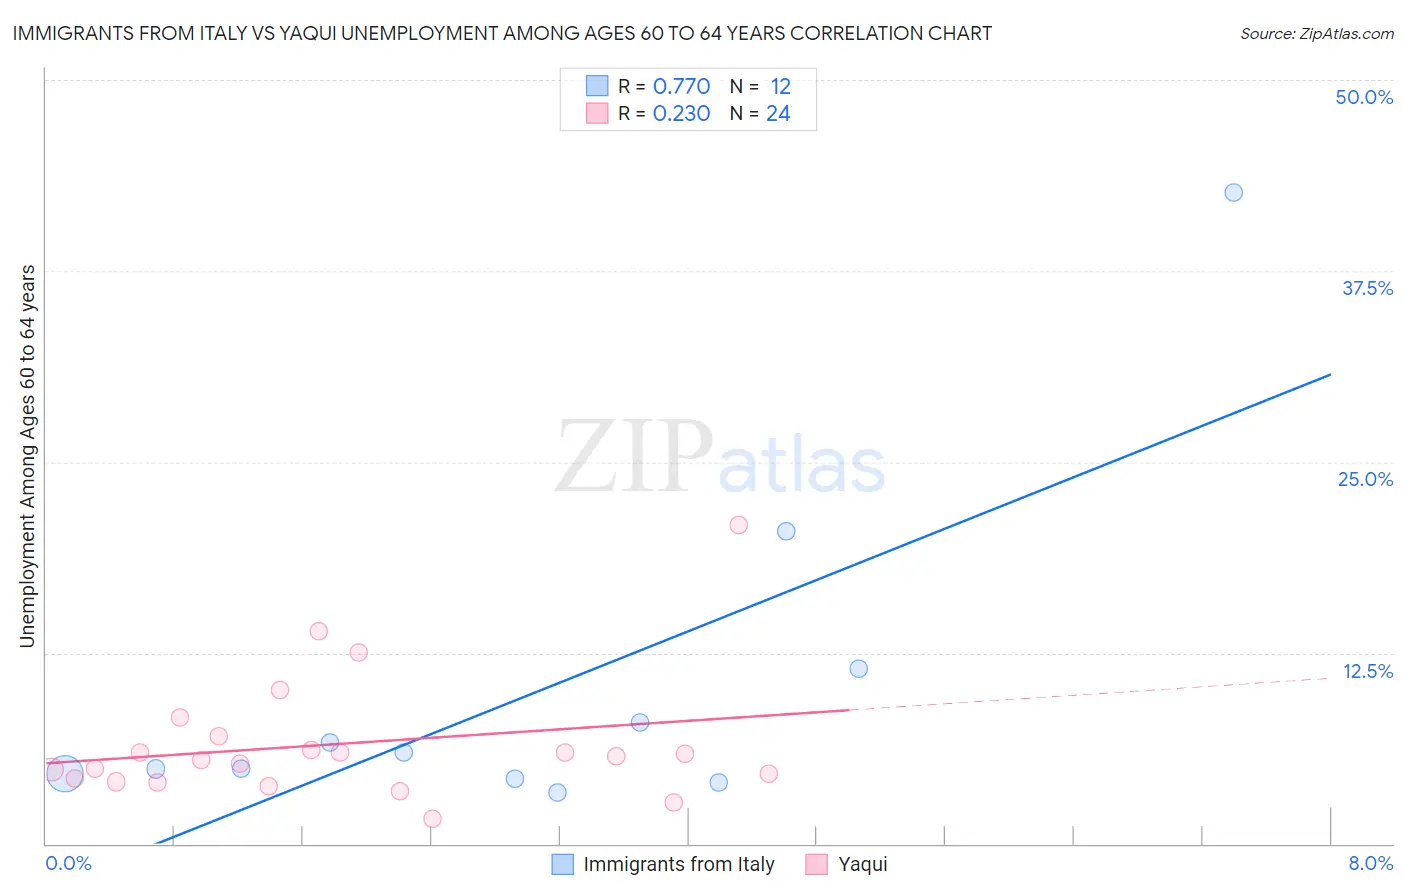
Immigrants from Italy vs Yaqui Unemployment Among Ages 60 to 64 years Correlation Chart
The statistical analysis conducted on geographies consisting of 301,146,361 people shows a strong positive correlation between the proportion of Immigrants from Italy and unemployment rate among population between the ages 60 and 64 in the United States with a correlation coefficient (R) of 0.770 and weighted average of 4.8%. Similarly, the statistical analysis conducted on geographies consisting of 104,841,690 people shows a weak positive correlation between the proportion of Yaqui and unemployment rate among population between the ages 60 and 64 in the United States with a correlation coefficient (R) of 0.230 and weighted average of 4.8%, a difference of 0.75%.
Unemployment Among Ages 60 to 64 years Correlation Summary
| Measurement | Immigrants from Italy | Yaqui |
| Minimum | 3.4% | 1.6% |
| Maximum | 42.6% | 20.9% |
| Range | 39.2% | 19.3% |
| Mean | 10.1% | 6.6% |
| Median | 5.4% | 5.6% |
| Interquartile 25% (IQ1) | 4.4% | 4.2% |
| Interquartile 75% (IQ3) | 9.7% | 6.6% |
| Interquartile Range (IQR) | 5.3% | 2.4% |
| Standard Deviation (Sample) | 11.3% | 4.2% |
| Standard Deviation (Population) | 10.8% | 4.1% |
Demographics Similar to Immigrants from Italy and Yaqui by Unemployment Among Ages 60 to 64 years
In terms of unemployment among ages 60 to 64 years, the demographic groups most similar to Immigrants from Italy are Arab (4.8%, a difference of 0.0%), Immigrants from South Africa (4.8%, a difference of 0.010%), Latvian (4.8%, a difference of 0.020%), Mongolian (4.8%, a difference of 0.14%), and Turkish (4.8%, a difference of 0.18%). Similarly, the demographic groups most similar to Yaqui are Immigrants from Lebanon (4.8%, a difference of 0.010%), Lithuanian (4.8%, a difference of 0.010%), Basque (4.8%, a difference of 0.060%), Pennsylvania German (4.8%, a difference of 0.15%), and French Canadian (4.8%, a difference of 0.16%).
| Demographics | Rating | Rank | Unemployment Among Ages 60 to 64 years |
| Immigrants | Lebanon | 89.6 /100 | #131 | Excellent 4.8% |
| Lithuanians | 89.6 /100 | #132 | Excellent 4.8% |
| Yaqui | 89.5 /100 | #133 | Excellent 4.8% |
| Basques | 88.8 /100 | #134 | Excellent 4.8% |
| Pennsylvania Germans | 87.8 /100 | #135 | Excellent 4.8% |
| French Canadians | 87.6 /100 | #136 | Excellent 4.8% |
| Cambodians | 86.9 /100 | #137 | Excellent 4.8% |
| Immigrants | Lithuania | 86.7 /100 | #138 | Excellent 4.8% |
| Immigrants | Africa | 86.6 /100 | #139 | Excellent 4.8% |
| Pima | 85.8 /100 | #140 | Excellent 4.8% |
| Panamanians | 85.5 /100 | #141 | Excellent 4.8% |
| Immigrants | Ethiopia | 85.3 /100 | #142 | Excellent 4.8% |
| Italians | 85.0 /100 | #143 | Excellent 4.8% |
| Immigrants | Pakistan | 83.3 /100 | #144 | Excellent 4.8% |
| Burmese | 83.1 /100 | #145 | Excellent 4.8% |
| Turks | 81.9 /100 | #146 | Excellent 4.8% |
| Mongolians | 81.2 /100 | #147 | Excellent 4.8% |
| Latvians | 79.1 /100 | #148 | Good 4.8% |
| Arabs | 78.8 /100 | #149 | Good 4.8% |
| Immigrants | Italy | 78.7 /100 | #150 | Good 4.8% |
| Immigrants | South Africa | 78.5 /100 | #151 | Good 4.8% |