Immigrants from Italy vs Finnish Unemployment Among Ages 60 to 64 years
COMPARE
Immigrants from Italy
Finnish
Unemployment Among Ages 60 to 64 years
Unemployment Among Ages 60 to 64 years Comparison
Immigrants from Italy
Finns
4.8%
UNEMPLOYMENT AMONG AGES 60 TO 64 YEARS
78.7/ 100
METRIC RATING
150th/ 347
METRIC RANK
4.7%
UNEMPLOYMENT AMONG AGES 60 TO 64 YEARS
94.7/ 100
METRIC RATING
123rd/ 347
METRIC RANK
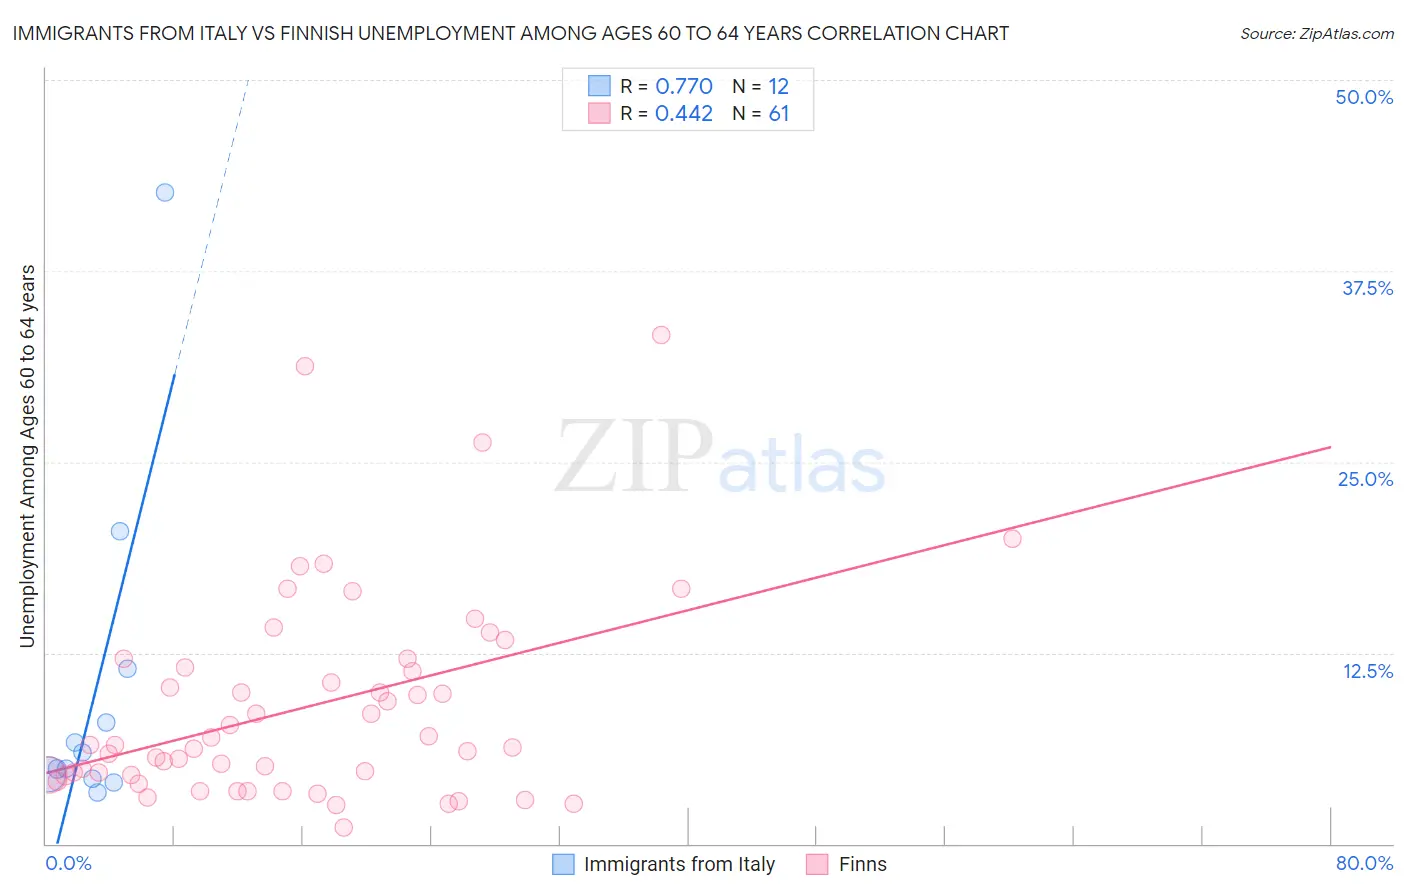
Immigrants from Italy vs Finnish Unemployment Among Ages 60 to 64 years Correlation Chart
The statistical analysis conducted on geographies consisting of 301,146,361 people shows a strong positive correlation between the proportion of Immigrants from Italy and unemployment rate among population between the ages 60 and 64 in the United States with a correlation coefficient (R) of 0.770 and weighted average of 4.8%. Similarly, the statistical analysis conducted on geographies consisting of 358,091,126 people shows a moderate positive correlation between the proportion of Finns and unemployment rate among population between the ages 60 and 64 in the United States with a correlation coefficient (R) of 0.442 and weighted average of 4.7%, a difference of 1.4%.
Unemployment Among Ages 60 to 64 years Correlation Summary
| Measurement | Immigrants from Italy | Finnish |
| Minimum | 3.4% | 1.1% |
| Maximum | 42.6% | 33.3% |
| Range | 39.2% | 32.2% |
| Mean | 10.1% | 9.0% |
| Median | 5.4% | 6.5% |
| Interquartile 25% (IQ1) | 4.4% | 4.5% |
| Interquartile 75% (IQ3) | 9.7% | 11.8% |
| Interquartile Range (IQR) | 5.3% | 7.3% |
| Standard Deviation (Sample) | 11.3% | 6.8% |
| Standard Deviation (Population) | 10.8% | 6.7% |
Similar Demographics by Unemployment Among Ages 60 to 64 years
Demographics Similar to Immigrants from Italy by Unemployment Among Ages 60 to 64 years
In terms of unemployment among ages 60 to 64 years, the demographic groups most similar to Immigrants from Italy are Arab (4.8%, a difference of 0.0%), Immigrants from South Africa (4.8%, a difference of 0.010%), Latvian (4.8%, a difference of 0.020%), Mongolian (4.8%, a difference of 0.14%), and American (4.8%, a difference of 0.15%).
| Demographics | Rating | Rank | Unemployment Among Ages 60 to 64 years |
| Italians | 85.0 /100 | #143 | Excellent 4.8% |
| Immigrants | Pakistan | 83.3 /100 | #144 | Excellent 4.8% |
| Burmese | 83.1 /100 | #145 | Excellent 4.8% |
| Turks | 81.9 /100 | #146 | Excellent 4.8% |
| Mongolians | 81.2 /100 | #147 | Excellent 4.8% |
| Latvians | 79.1 /100 | #148 | Good 4.8% |
| Arabs | 78.8 /100 | #149 | Good 4.8% |
| Immigrants | Italy | 78.7 /100 | #150 | Good 4.8% |
| Immigrants | South Africa | 78.5 /100 | #151 | Good 4.8% |
| Americans | 75.7 /100 | #152 | Good 4.8% |
| Bolivians | 75.5 /100 | #153 | Good 4.8% |
| Chileans | 72.6 /100 | #154 | Good 4.8% |
| Filipinos | 72.1 /100 | #155 | Good 4.8% |
| Immigrants | Bolivia | 69.2 /100 | #156 | Good 4.8% |
| Laotians | 66.8 /100 | #157 | Good 4.8% |
Demographics Similar to Finns by Unemployment Among Ages 60 to 64 years
In terms of unemployment among ages 60 to 64 years, the demographic groups most similar to Finns are Immigrants from Senegal (4.7%, a difference of 0.030%), Immigrants from Kazakhstan (4.7%, a difference of 0.090%), Albanian (4.7%, a difference of 0.11%), Immigrants from Thailand (4.7%, a difference of 0.17%), and Macedonian (4.7%, a difference of 0.19%).
| Demographics | Rating | Rank | Unemployment Among Ages 60 to 64 years |
| Immigrants | England | 96.3 /100 | #116 | Exceptional 4.7% |
| Immigrants | Germany | 96.3 /100 | #117 | Exceptional 4.7% |
| Ukrainians | 96.1 /100 | #118 | Exceptional 4.7% |
| Immigrants | Morocco | 95.7 /100 | #119 | Exceptional 4.7% |
| Macedonians | 95.7 /100 | #120 | Exceptional 4.7% |
| Albanians | 95.3 /100 | #121 | Exceptional 4.7% |
| Immigrants | Kazakhstan | 95.1 /100 | #122 | Exceptional 4.7% |
| Finns | 94.7 /100 | #123 | Exceptional 4.7% |
| Immigrants | Senegal | 94.5 /100 | #124 | Exceptional 4.7% |
| Immigrants | Thailand | 93.7 /100 | #125 | Exceptional 4.7% |
| Immigrants | South Central Asia | 93.0 /100 | #126 | Exceptional 4.7% |
| Austrians | 91.9 /100 | #127 | Exceptional 4.8% |
| Choctaw | 90.3 /100 | #128 | Exceptional 4.8% |
| Immigrants | Serbia | 90.2 /100 | #129 | Exceptional 4.8% |
| Immigrants | Syria | 90.1 /100 | #130 | Exceptional 4.8% |