Immigrants from Italy vs Slovak Unemployment Among Ages 30 to 34 years
COMPARE
Immigrants from Italy
Slovak
Unemployment Among Ages 30 to 34 years
Unemployment Among Ages 30 to 34 years Comparison
Immigrants from Italy
Slovaks
5.3%
UNEMPLOYMENT AMONG AGES 30 TO 34 YEARS
81.1/ 100
METRIC RATING
123rd/ 347
METRIC RANK
5.8%
UNEMPLOYMENT AMONG AGES 30 TO 34 YEARS
2.5/ 100
METRIC RATING
224th/ 347
METRIC RANK
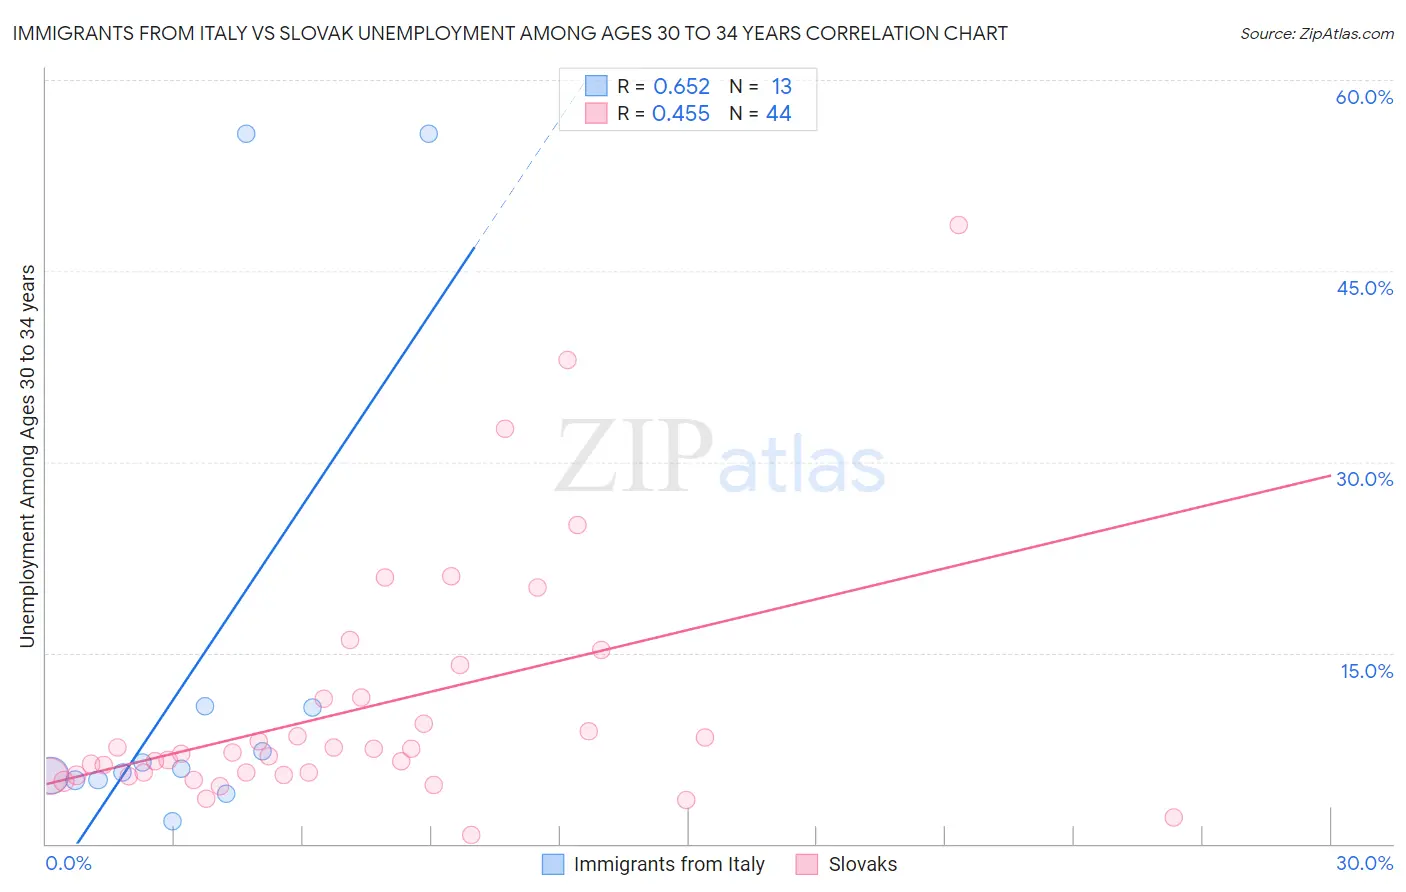
Immigrants from Italy vs Slovak Unemployment Among Ages 30 to 34 years Correlation Chart
The statistical analysis conducted on geographies consisting of 307,180,999 people shows a significant positive correlation between the proportion of Immigrants from Italy and unemployment rate among population between the ages 30 and 34 in the United States with a correlation coefficient (R) of 0.652 and weighted average of 5.3%. Similarly, the statistical analysis conducted on geographies consisting of 367,753,529 people shows a moderate positive correlation between the proportion of Slovaks and unemployment rate among population between the ages 30 and 34 in the United States with a correlation coefficient (R) of 0.455 and weighted average of 5.8%, a difference of 9.1%.
Unemployment Among Ages 30 to 34 years Correlation Summary
| Measurement | Immigrants from Italy | Slovak |
| Minimum | 1.8% | 0.70% |
| Maximum | 55.8% | 48.6% |
| Range | 54.0% | 47.9% |
| Mean | 13.8% | 10.6% |
| Median | 5.9% | 7.1% |
| Interquartile 25% (IQ1) | 5.0% | 5.4% |
| Interquartile 75% (IQ3) | 10.8% | 11.5% |
| Interquartile Range (IQR) | 5.8% | 6.1% |
| Standard Deviation (Sample) | 18.8% | 9.7% |
| Standard Deviation (Population) | 18.1% | 9.6% |
Similar Demographics by Unemployment Among Ages 30 to 34 years
Demographics Similar to Immigrants from Italy by Unemployment Among Ages 30 to 34 years
In terms of unemployment among ages 30 to 34 years, the demographic groups most similar to Immigrants from Italy are Immigrants from Brazil (5.3%, a difference of 0.030%), Greek (5.3%, a difference of 0.080%), Immigrants from Netherlands (5.3%, a difference of 0.090%), Immigrants from Sri Lanka (5.3%, a difference of 0.10%), and Romanian (5.3%, a difference of 0.14%).
| Demographics | Rating | Rank | Unemployment Among Ages 30 to 34 years |
| Eastern Europeans | 83.2 /100 | #116 | Excellent 5.3% |
| Australians | 83.1 /100 | #117 | Excellent 5.3% |
| Immigrants | South Africa | 83.0 /100 | #118 | Excellent 5.3% |
| New Zealanders | 82.5 /100 | #119 | Excellent 5.3% |
| Immigrants | Poland | 82.4 /100 | #120 | Excellent 5.3% |
| Romanians | 82.3 /100 | #121 | Excellent 5.3% |
| Immigrants | Netherlands | 81.8 /100 | #122 | Excellent 5.3% |
| Immigrants | Italy | 81.1 /100 | #123 | Excellent 5.3% |
| Immigrants | Brazil | 80.8 /100 | #124 | Excellent 5.3% |
| Greeks | 80.4 /100 | #125 | Excellent 5.3% |
| Immigrants | Sri Lanka | 80.2 /100 | #126 | Excellent 5.3% |
| Taiwanese | 79.4 /100 | #127 | Good 5.3% |
| Immigrants | Uruguay | 79.3 /100 | #128 | Good 5.3% |
| Poles | 78.8 /100 | #129 | Good 5.3% |
| Germans | 77.8 /100 | #130 | Good 5.3% |
Demographics Similar to Slovaks by Unemployment Among Ages 30 to 34 years
In terms of unemployment among ages 30 to 34 years, the demographic groups most similar to Slovaks are Samoan (5.8%, a difference of 0.030%), Bermudan (5.8%, a difference of 0.15%), Liberian (5.8%, a difference of 0.15%), Spaniard (5.8%, a difference of 0.41%), and Spanish (5.8%, a difference of 0.50%).
| Demographics | Rating | Rank | Unemployment Among Ages 30 to 34 years |
| Immigrants | Fiji | 5.1 /100 | #217 | Tragic 5.7% |
| Panamanians | 4.5 /100 | #218 | Tragic 5.8% |
| French Canadians | 4.4 /100 | #219 | Tragic 5.8% |
| Sierra Leoneans | 3.9 /100 | #220 | Tragic 5.8% |
| Guamanians/Chamorros | 3.9 /100 | #221 | Tragic 5.8% |
| Spaniards | 3.2 /100 | #222 | Tragic 5.8% |
| Bermudans | 2.7 /100 | #223 | Tragic 5.8% |
| Slovaks | 2.5 /100 | #224 | Tragic 5.8% |
| Samoans | 2.5 /100 | #225 | Tragic 5.8% |
| Liberians | 2.3 /100 | #226 | Tragic 5.8% |
| Spanish | 1.8 /100 | #227 | Tragic 5.8% |
| Immigrants | Bahamas | 1.8 /100 | #228 | Tragic 5.8% |
| Immigrants | Uzbekistan | 1.5 /100 | #229 | Tragic 5.9% |
| Hawaiians | 1.2 /100 | #230 | Tragic 5.9% |
| Japanese | 1.1 /100 | #231 | Tragic 5.9% |