Ecuadorian vs Slovak Unemployment Among Ages 30 to 34 years
COMPARE
Ecuadorian
Slovak
Unemployment Among Ages 30 to 34 years
Unemployment Among Ages 30 to 34 years Comparison
Ecuadorians
Slovaks
6.3%
UNEMPLOYMENT AMONG AGES 30 TO 34 YEARS
0.0/ 100
METRIC RATING
275th/ 347
METRIC RANK
5.8%
UNEMPLOYMENT AMONG AGES 30 TO 34 YEARS
2.5/ 100
METRIC RATING
224th/ 347
METRIC RANK
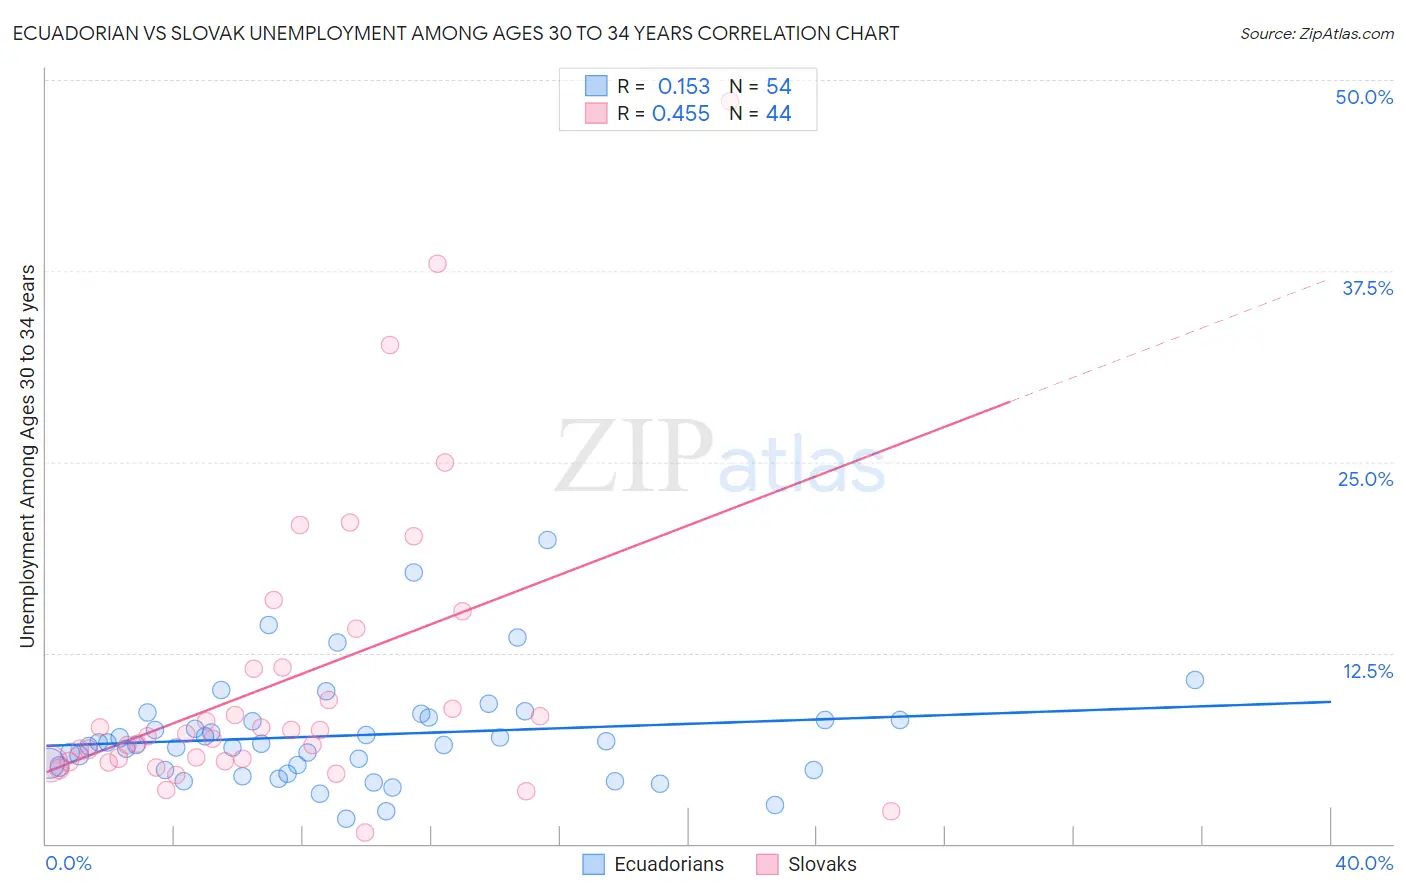
Ecuadorian vs Slovak Unemployment Among Ages 30 to 34 years Correlation Chart
The statistical analysis conducted on geographies consisting of 305,085,687 people shows a poor positive correlation between the proportion of Ecuadorians and unemployment rate among population between the ages 30 and 34 in the United States with a correlation coefficient (R) of 0.153 and weighted average of 6.3%. Similarly, the statistical analysis conducted on geographies consisting of 367,753,529 people shows a moderate positive correlation between the proportion of Slovaks and unemployment rate among population between the ages 30 and 34 in the United States with a correlation coefficient (R) of 0.455 and weighted average of 5.8%, a difference of 8.2%.
Unemployment Among Ages 30 to 34 years Correlation Summary
| Measurement | Ecuadorian | Slovak |
| Minimum | 1.6% | 0.70% |
| Maximum | 19.9% | 48.6% |
| Range | 18.3% | 47.9% |
| Mean | 7.1% | 10.6% |
| Median | 6.5% | 7.1% |
| Interquartile 25% (IQ1) | 4.8% | 5.4% |
| Interquartile 75% (IQ3) | 8.1% | 11.5% |
| Interquartile Range (IQR) | 3.3% | 6.1% |
| Standard Deviation (Sample) | 3.5% | 9.7% |
| Standard Deviation (Population) | 3.5% | 9.6% |
Similar Demographics by Unemployment Among Ages 30 to 34 years
Demographics Similar to Ecuadorians by Unemployment Among Ages 30 to 34 years
In terms of unemployment among ages 30 to 34 years, the demographic groups most similar to Ecuadorians are Pennsylvania German (6.3%, a difference of 0.050%), U.S. Virgin Islander (6.3%, a difference of 0.10%), Ottawa (6.3%, a difference of 0.11%), Blackfeet (6.3%, a difference of 0.13%), and Comanche (6.3%, a difference of 0.24%).
| Demographics | Rating | Rank | Unemployment Among Ages 30 to 34 years |
| Immigrants | Haiti | 0.0 /100 | #268 | Tragic 6.2% |
| French American Indians | 0.0 /100 | #269 | Tragic 6.3% |
| Immigrants | Senegal | 0.0 /100 | #270 | Tragic 6.3% |
| Comanche | 0.0 /100 | #271 | Tragic 6.3% |
| Blackfeet | 0.0 /100 | #272 | Tragic 6.3% |
| Ottawa | 0.0 /100 | #273 | Tragic 6.3% |
| U.S. Virgin Islanders | 0.0 /100 | #274 | Tragic 6.3% |
| Ecuadorians | 0.0 /100 | #275 | Tragic 6.3% |
| Pennsylvania Germans | 0.0 /100 | #276 | Tragic 6.3% |
| Immigrants | Ecuador | 0.0 /100 | #277 | Tragic 6.3% |
| Osage | 0.0 /100 | #278 | Tragic 6.3% |
| Cree | 0.0 /100 | #279 | Tragic 6.4% |
| Cherokee | 0.0 /100 | #280 | Tragic 6.4% |
| Immigrants | Caribbean | 0.0 /100 | #281 | Tragic 6.4% |
| Africans | 0.0 /100 | #282 | Tragic 6.4% |
Demographics Similar to Slovaks by Unemployment Among Ages 30 to 34 years
In terms of unemployment among ages 30 to 34 years, the demographic groups most similar to Slovaks are Samoan (5.8%, a difference of 0.030%), Bermudan (5.8%, a difference of 0.15%), Liberian (5.8%, a difference of 0.15%), Spaniard (5.8%, a difference of 0.41%), and Spanish (5.8%, a difference of 0.50%).
| Demographics | Rating | Rank | Unemployment Among Ages 30 to 34 years |
| Immigrants | Fiji | 5.1 /100 | #217 | Tragic 5.7% |
| Panamanians | 4.5 /100 | #218 | Tragic 5.8% |
| French Canadians | 4.4 /100 | #219 | Tragic 5.8% |
| Sierra Leoneans | 3.9 /100 | #220 | Tragic 5.8% |
| Guamanians/Chamorros | 3.9 /100 | #221 | Tragic 5.8% |
| Spaniards | 3.2 /100 | #222 | Tragic 5.8% |
| Bermudans | 2.7 /100 | #223 | Tragic 5.8% |
| Slovaks | 2.5 /100 | #224 | Tragic 5.8% |
| Samoans | 2.5 /100 | #225 | Tragic 5.8% |
| Liberians | 2.3 /100 | #226 | Tragic 5.8% |
| Spanish | 1.8 /100 | #227 | Tragic 5.8% |
| Immigrants | Bahamas | 1.8 /100 | #228 | Tragic 5.8% |
| Immigrants | Uzbekistan | 1.5 /100 | #229 | Tragic 5.9% |
| Hawaiians | 1.2 /100 | #230 | Tragic 5.9% |
| Japanese | 1.1 /100 | #231 | Tragic 5.9% |